Abstract
Reliability-Centered Maintenance (RCM) has served as the dominant industrial maintenance philosophy for nearly five decades, delivering substantial gains in safety, availability, and cost control. However, its core vocabulary, built around Failure Mode, Mean Time Between Failures, and the Potential-to-Functional Failure curve, frames organizational cognition around breakdown rather than performance excellence. This article proposes a complementary, success-oriented framework, the Potential Success Curve (PSC), and demonstrates its practical alignment with contemporary asset management practice. Methodologically, the study employs an integrative cross-disciplinary review with deductive construct development, comparative standards analysis, and worked operational examples. Grounded in Prospect Theory, Appreciative Inquiry, Safety-II, and the lineage of transformative management methodologies including Total Productive Maintenance (TPM), Lean, Total Quality Management, and Six Sigma, the framework introduces several novel constructs: the Golden Spot (an asset’s optimal performance envelope), Mean Time of Optimal Performance (MTOP), Mean Time to Restore Golden Spot (MTTRg), Success Rate, Overall Performance Excellence (OPE), Success Mode and Effects Analysis (SMEA), and Root Success Analysis (RSA). A new D-I-S-G model extends the traditional D-I-P-F curve. The framework is operationalized through a SMART (Specific, Measurable, Applicable, Realistic, Time-bound) validation structure and is mapped explicitly to ISO 55000: 2024, ISO 55001: 2024, API 580/581, SAE JA1011, ISO 14224, and IEC 60300. The article further demonstrates how emerging technologies, including artificial intelligence, digital twins, and the Industrial Internet of Things, serve as practical enablers of the framework, and quantifies the potential impact on the industrial business landscape. While the proposed constructs require empirical validation, their theoretical foundations are individually well established, and the framework is positioned as a complementary layer that enhances rather than replaces established practice. The principal limitation of the study is the absence of primary empirical data; all proposed constructs are explicitly formulated as testable propositions, and the research agenda for field validation is set out in Section 12.2.
|
Published in
|
Science, Technology & Public Policy (Volume 10, Issue 2)
|
|
DOI
|
10.11648/j.stpp.20261002.11
|
|
Page(s)
|
20-34 |
|
Creative Commons
|

This is an Open Access article, distributed under the terms of the Creative Commons Attribution 4.0 International License (http://creativecommons.org/licenses/by/4.0/), which permits unrestricted use, distribution and reproduction in any medium or format, provided the original work is properly cited.
|
|
Copyright
|
Copyright © The Author(s), 2026. Published by Science Publishing Group
|
Keywords
Potential Success Curve, ISO 55000: 2024, Asset Management, Golden Spot, Mean Time of Optimal Performance,
Success Mode and Effects Analysis, Industry 4.0, Reliability Engineering
1. Introduction
For more than half a century, the asset management and reliability community has relied on Reliability-Centered Maintenance (RCM) as the dominant maintenance philosophy. RCM has delivered transformative results: it reduced Boeing 747 maintenance labor from 4 million hours to 66,000 hours
| [1] | HBK World. Creating Initial Scheduled Maintenance Plans for Aircraft, MSG-3. Available from:
https://www.hbkworld.com (accessed 15 March 2025). |
| [2] | Smith, A. M. Reliability-Centered Maintenance. New York: McGraw-Hill; 1993. |
[1, 2]
, established evidence-based maintenance scheduling across safety-critical industries
| [3] | Nowlan, F. S., Heap, H. F. Reliability-Centered Maintenance. Report AD-A066579. Washington, DC: U.S. Department of Defense; 1978. |
[3]
, and provided the analytical foundation for civil aviation, nuclear power, and rail transport. These achievements are substantial and well documented.
However, the methodology has also embedded a predominantly deficit-oriented psychological framework into maintenance practice. Its core vocabulary, including Failure Mode, Root Cause of failure, Mean Time Between Failures, and the P-F Curve, implicitly frames organizational thinking around breakdowns, risks, and degradation rather than around resilience, value creation, and performance optimization. While this framing was essential during RCM’s formative decades, the discipline has since evolved. The 2024 revision of the ISO 55000 series reframes asset management around value, assurance, adaptability, and sustainability outcomes
| [4] | International Organization for Standardization. ISO 55000: 2024 and ISO 55001: 2024, Asset Management: Vocabulary, Overview, Principles and Requirements. Geneva: ISO; 2024. |
[4]
, signaling an industry-wide shift from failure avoidance toward value realization.
This article proposes a complementary framework, the Potential Success Curve (PSC), and goes beyond conceptual advocacy to demonstrate practical applicability. Specifically, the article: (a) situates the framework within the lineage of historic management breakthroughs that reframed industrial practice; (b) operationalizes each construct through a SMART validation structure; (c) maps the framework explicitly to ISO 55000: 2024 and to API, SAE, IEC, and ISO reliability standards; (d) demonstrates how artificial intelligence, digital twins, and the Industrial Internet of Things enable the framework in modern operating environments; and (e) quantifies the potential impact on the industrial business landscape.
The PSC framework does not seek to replace RCM’s analytical methods, which remain essential for safety-critical applications. Rather, it proposes a complementary philosophical and operational layer that reorients maintenance culture from preventing failure toward sustaining excellence, unlocking performance gains that failure-centric frameworks, by design, do not target.
1.1. Research Approach
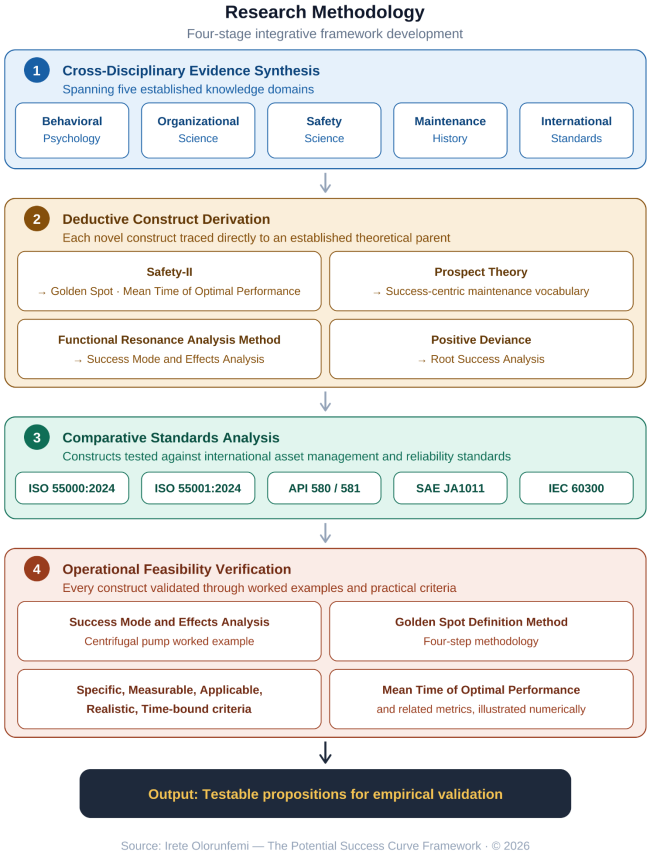
This article is a conceptual review. The methodology is an integrative literature review combined with deductive framework development, conducted in four stages. First, a cross-disciplinary evidence synthesis was performed spanning behavioral psychology, organizational science, safety science, maintenance management history, and the governing body of international standards (ISO, API, SAE, and IEC). Sources comprised peer-reviewed journal articles, published international standards, government and industry technical reports, and documented industrial case studies. Second, each novel construct was derived deductively from an established theoretical foundation, with the derivation made explicit in
Table 3 so that the intellectual basis of every construct is traceable. Third, the proposed constructs were subjected to comparative analysis against incumbent tools and standards (
Tables 2, 6, and 7) to establish complementarity rather than redundancy. Fourth, operational feasibility was verified through a worked SMEA example (
Table 5), a four-step Golden Spot definition method, and validation of the complete framework against SMART criteria (
Table 6).
No primary empirical data were collected. The article is positioned as a conceptual contribution in which the propositions are explicitly formulated for subsequent empirical testing, and the corresponding research agenda is set out in Section 12.2. This staging, in which conceptual synthesis precedes controlled validation, follows the established development pattern of the management frameworks reviewed in Section 3.
This framework relies on two distinct methodological modes. First, I use a deductive approach to derive novel constructs directly from established theories, ensuring each has a traceable theoretical parent (see
Table 3). Second, I apply interpretive judgment in the integrative stages to synthesize evidence across disparate disciplines and translate these foundations into practical maintenance applications.
1.2. Significance of the Study
The significance of this study is fivefold. First, it offers the first formal synthesis bridging behavioral-science framing effects with maintenance metrics and culture, a connection that is intuitive to practitioners but absent from the published maintenance literature. Second, it supplies the value-delivery metric layer that ISO 55000: 2024 calls for but does not prescribe: MTOP, Success Rate, and OPE give organizations concrete, auditable measures with which to populate the Strategic Asset Management Plan required by ISO 55001: 2024.
Third, it directly addresses the documented finding that 60 to 70% of predictive maintenance initiatives miss their targets and that approximately 68% of the barriers are organizational rather than technical
| [39] | Prosci. Kotter’s Change Management Theory: Explanation and Applications. Available from: https://www.prosci.com (accessed 28 March 2025). |
[39]
, by acting on culture and language, the layer that additional technology spending cannot reach. Fourth, it provides a structured life-extension logic for the aging-asset challenge represented by the $3.7 trillion United States infrastructure gap
| [33] | American Society of Civil Engineers. 2025 Infrastructure Report Card. Washington, DC: ASCE; 2025. |
[33]
and comparable fleets worldwide. Fifth, it redirects the rapidly growing investment in artificial intelligence and digital twins from the question “when will this asset fail?” toward the higher-value question “how long can this asset sustain optimal performance?”, thereby increasing the return on technology already being purchased.
Figure 1. Methodological flow diagram: four-stage integrative review with deductive construct development. Each stage produces traceable outputs that feed the next, culminating in testable propositions for empirical validation.
2. Methodological Limitations of Established RCM Tools
The traditional RCM toolkit has been refined substantially since Nowlan and Heap’s foundational 1978 report
| [3] | Nowlan, F. S., Heap, H. F. Reliability-Centered Maintenance. Report AD-A066579. Washington, DC: U.S. Department of Defense; 1978. |
[3]
. Enhanced Failure Mode and Effects Analysis (FMEA) methods, hazard-based reliability metrics, and advanced Weibull modeling have addressed many early criticisms. Nevertheless, significant limitations persist in inter-rater reliability, metric interpretation, and analytical framing.
Table 1 summarizes documented limitations alongside acknowledged strengths.
Table 1. Established RCM tools: documented strengths and persistent limitations.
Tool | Acknowledged Strength | Persistent Limitation | Source |
FMEA | Systematic failure-mode identification; standardized (IEC 60812) | Risk Priority Number (RPN) lacks uniqueness; high inter-rater subjectivity; ignores failure-mode interactions | Peerally et al. |
MTBF | Simple comparison metric for populations | Assumes constant failure rate; 63.2% fail at t=MTBF; misapplied to individual components | Schenkelberg ; Accendo Reliability |
RCA | Structured investigation for bounded problems | Promotes reductionist single-cause thinking; favors linear over systemic logic | Peerally et al. ; Snowden | [11] | Snowden, D. Root ‘Cause’ & Complexity. The Cynefin Co. Available from: https://thecynefin.co
(accessed 22 March 2025). |
[11] |
P-F Curve | Intuitive degradation visualization; guides inspection | False certainty on timelines; cannot detect sudden failures; P-F interval never known precisely | Todd ; Plucknette |
The Psychological Case for Reframing:
Beyond methodology, the case for reframing draws on established behavioral science. Kahneman and Tversky’s Prospect Theory
demonstrated that losses are psychologically approximately twice as powerful as equivalent gains, and that identical choices framed as “lives saved” versus “lives lost” produce reversed decisions. Applied to maintenance, organizations immersed in failure language may exhibit systematically more conservative decision-making than those framed around performance. Van Woerkom and Meyers
found that strengths use predicts job performance, while deficit correction does not, a finding corroborated by the broader organizational evidence on strengths use
. Cooperrider’s Appreciative Inquiry
| [6] | Cooperrider, D. L., Srivastva, S. Appreciative Inquiry in Organizational Life. In Research in Organizational Change and Development. Greenwich, CT: JAI Press; 1987, pp. 129-169. |
[6]
established that organizations grow in the direction of their persistent inquiries. Bushe
| [16] | Bushe, G. R. Appreciative Inquiry: Theory and Critique. In The Routledge Companion to Organizational Change. London: Routledge; 2012, pp. 87-103. |
[16]
cautions that this generative effect depends on authentic inquiry rather than mandated positivity, a caution that applies equally to the adoption of success-centric language in maintenance. It must be noted that while this evidence is robust in general organizational settings, it has not been empirically tested in maintenance-specific environments, and the application to maintenance culture represents a theoretically grounded hypothesis.
3. Theoretical Foundations and the Lineage of Management Breakthroughs
The PSC framework does not emerge in isolation. It belongs to a recognizable lineage of management breakthroughs, each of which reframed an established industrial practice, was initially met with skepticism, and ultimately became standard. Understanding this lineage clarifies both the framework’s intellectual foundations and the adoption pattern it is likely to follow.
3.1. Lessons from Historic Breakthroughs
Table 2. PSC within the lineage of transformative management methodologies.
Methodology | Origin | Reframing Achieved | Relevance to PSC |
TQM / Deming | 1950s, Japan | Quality as everyone’s responsibility, built in rather than inspected out | Established that culture and mindset drive measurable outcomes |
Toyota Production System / Lean | 1950s-70s | Value defined by the customer; relentless elimination of waste | Reframed “what matters” from cost to value, mirroring PSC’s value focus |
TPM (Nakajima) | 1971 | Maintenance as a pursuit of perfect production via OEE | Direct precedent; PSC extends OEE thinking to the asset-specific Golden Spot |
Six Sigma | 1986, Motorola | Variation reduction as a quantified, statistically governed discipline | Demonstrated that a new metric language can reshape an entire industry |
Safety-II (Hollnagel) | 2014 | Safety as the ability to succeed under varying conditions | Provides the analytical backbone for measuring success, not only failure |
Total Productive Maintenance (TPM), formalized by Seiichi Nakajima at the Japan Institute of Plant Maintenance in 1971, reframed maintenance from a reactive repair function into a company-wide pursuit of “perfect production” measured by Overall Equipment Effectiveness (OEE)
| [21] | Nakajima, S. Introduction to TPM: Total Productive Maintenance. Cambridge, MA: Productivity Press; 1988. |
[21]
. TPM is the closest existing large-scale precedent for success-framed maintenance, and the PSC framework can be understood as extending TPM’s philosophy from the production line to the individual asset.
Table 2 situates PSC within this broader lineage.
Each of these breakthroughs followed a common pattern: a reframing that initially appeared radical, resistance from established practitioners, and eventual adoption as orthodoxy. The PSC framework is presented in full awareness of this pattern, and the limitations section acknowledges that, like its predecessors, it requires empirical validation before widespread adoption.
3.2. Theoretical Mapping
Table 3 maps the established theoretical foundations to the proposed framework constructs, demonstrating that each novel construct rests on a recognized body of knowledge.
Table 3. Theoretical foundations mapping to proposed constructs.
Foundation | Core Principle | PSC Construct |
Safety-II (Hollnagel) | [18] | Hollnagel, E. Safety-I and Safety-II: The Past and Future of Safety Management. Farnham: Ashgate; 2014. |
[18] | Safety is the ability to succeed under varying conditions | Golden Spot; MTOP |
Prospect Theory | Framing changes decisions; losses weigh more than gains | Success-centric vocabulary |
Appreciative Inquiry | [6] | Cooperrider, D. L., Srivastva, S. Appreciative Inquiry in Organizational Life. In Research in Organizational Change and Development. Greenwich, CT: JAI Press; 1987, pp. 129-169. |
[6] | Systems grow toward their persistent inquiries | Root Success Analysis |
FRAM (Hollnagel) | [19] | Hollnagel, E. FRAM: The Functional Resonance Analysis Method. Farnham: Ashgate; 2012. |
[19] | Model functions, not only failure modes | SMEA methodology |
Positive Deviance | [20] | Sternin, J., Choo, R. The Power of Positive Deviance. Harvard Business Review. 2000, 78(1), 14-15. |
[20] | Study positive outliers to identify success factors | RSA methodology |
ISO 55000: 2024 | [4] | International Organization for Standardization. ISO 55000: 2024 and ISO 55001: 2024, Asset Management: Vocabulary, Overview, Principles and Requirements. Geneva: ISO; 2024. |
[4] | Assets exist to deliver value, assurance, adaptability, sustainability | OPE; Success Rate |
4. The Proposed Framework: Potential Success Curve
4.1. The Golden Spot
The Golden Spot represents the state where an asset operates at peak efficiency, lowest unit cost, highest quality output, and optimal energy consumption. Rather than asking “how far is this asset from failure?” the question becomes “how close is this asset to its Golden Spot?” The Golden Spot is both asset-specific and life-stage specific: a 20-year-old pump has a different Golden Spot than a new one, but it still has one.
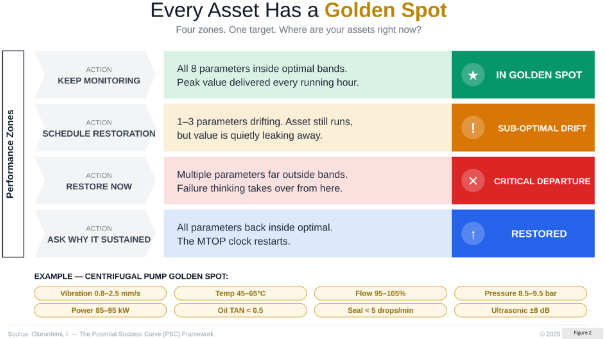
Defining the Golden Spot follows a four-step methodology: (a) identify the asset’s primary value-delivery function; (b) determine the 6 to 10 operating parameters that most directly indicate optimal performance; (c) establish parameter bands using Original Equipment Manufacturer (OEM) specifications, historical data from best-performing units, and engineering judgment; and (d) validate with operators.
Figure 2 illustrates this methodology applied to a centrifugal pump.
Figure 2. The Golden Spot application for a centrifugal pump, showing eight measurable parameters and four performance zones.
4.2. The D-I-S-G Model
The traditional D-I-P-F curve
| [22] | Etchison, D. M. The Extended D-I-P-F Curve. 2016. |
[22]
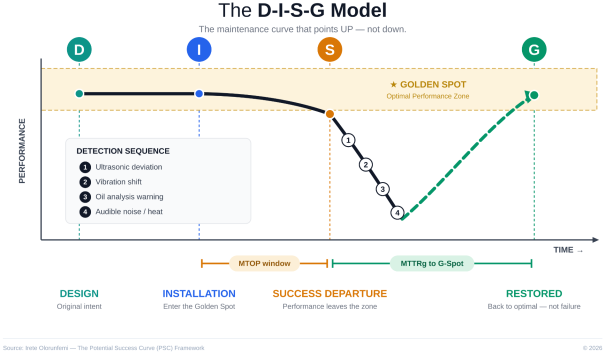
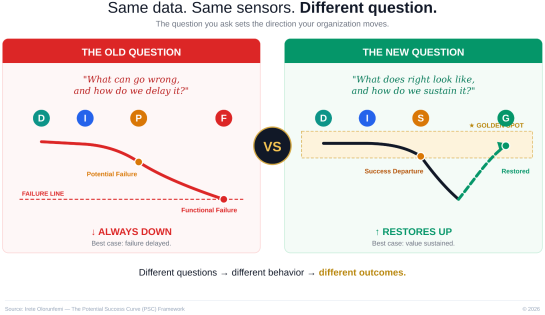
is extended into the D-I-S-G model (Design, Installation, Success departure, Golden Spot restoration), which reorients the trajectory from inevitable descent toward failure to a restorable departure-and-return cycle. Point S (Success Departure) replaces Point P (Potential Failure); detection triggers success-condition monitoring rather than failure detection. Point G (Golden Spot Restoration) replaces Point F (Functional Failure); the trajectory is upward toward restoration rather than downward toward catastrophe.
Figure 3 presents the model and
Figure 4 compares it with the traditional curve.
Figure 3. The D-I-S-G model showing intervals, MTOP and MTTRg windows, maintenance strategy zones, and detection callouts.
Figure 4. Side-by-side comparison of the traditional D-I-P-F curve and the proposed D-I-S-G Potential Success Curve. The same monitoring data answers two fundamentally different questions.
4.3. Novel Metrics
The framework introduces four metrics that complement traditional measures, presented in Equations (1) through (4).
Mean Time of Optimal Performance (MTOP)
MTOP = Σ(Time in Golden Spot) / N (1)
Mean Time to Restore Golden Spot (MTTRg)
MTTRg = Σ(Restoration Duration) / N(2)
Success Rate (SR)
SR(t) = MTOP / (MTOP + MTTRg) × 100% (3)
Overall Performance Excellence (OPE)
where PQ is Production Quality and EE is Energy Efficiency (actual versus optimal consumption). MTOP complements MTBF, MTTRg extends MTTR, SR is analogous to Availability measured against optimal performance (target ≥90%; world-class ≥95%), and OPE extends OEE by adding an energy-efficiency dimension that directly supports the sustainability outcome introduced in ISO 55000: 2024 (target ≥85%).
Table 4 provides a hypothetical numerical illustration of the four metrics applied to a centrifugal pump monitored over a 90-day (2,160-hour) operating period in which three complete Golden Spot departure-and-restoration cycles were observed.
Table 4. Hypothetical numerical illustration of PSC metrics for a centrifugal pump over a 90-day monitoring period.
Cycle | Hours in Golden Spot | Hours to Restore (MTTRg) | Notes |
1 | 680 h | 14 h | Bearing temp drifted; realigned coupling |
2 | 612 h | 9 h | Oil condition departure; flushed and recharged |
3 | 698 h | 11 h | Vibration shift; re-balanced impeller |
Calculated metrics | MTOP = (680 + 612 + 698) / 3 = 663.3 h | MTTRg = (14 + 9 + 11) / 3 = 11.3 h SR = 663.3 / (663.3 + 11.3) × 100% = 98.3% | PQ = 97.8% | EE = 95.4% OPE = 0.983 × 0.978 × 0.954 = 91.7% → World-class performance (SR ≥95%; OPE ≥85%) |
4.4. Success Mode and Effects Analysis (SMEA)
SMEA is a value-centric complement to FMEA. Instead of cataloging failure modes, SMEA identifies the conditions that enable optimal performance and analyzes the effects of their degradation, drawing on the functional logic of FRAM
| [19] | Hollnagel, E. FRAM: The Functional Resonance Analysis Method. Farnham: Ashgate; 2012. |
[19]
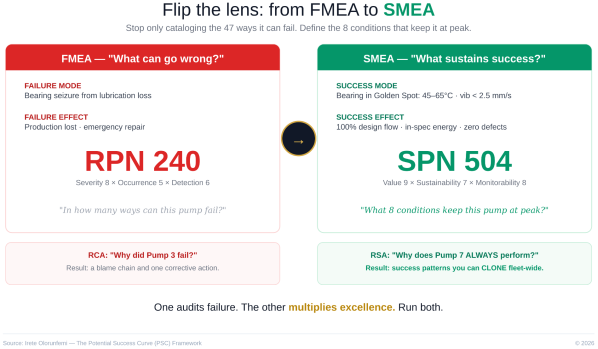
. SMEA introduces a Success Priority Number (SPN), calculated as Value Impact × Sustainability × Monitorability.
Table 5 provides a worked example for a centrifugal pump, and
Figure 5 illustrates the structural shift from failure-mode cataloging to success-condition characterization.
Table 5. Worked SMEA example: centrifugal pump success modes and Success Priority Numbers.
Success Mode | Success Condition | Value Impact | Sustain-ability | Monitor-ability | SPN | Priority Action |
Bearing within thermal envelope | Temp 45-65°C; vib <2.5 mm/s | 9 | 7 | 9 | 567 | Continuous vibration and temp monitoring |
Optimal lubrication film | TAN <0.5; viscosity ±10% | 8 | 6 | 8 | 384 | Quarterly oil analysis; trend TAN |
Design throughput maintained | 95-105% of design flow | 9 | 8 | 7 | 504 | Flow transmitter with Golden Spot alarm |
Seal integrity sustained | Leakage <5 drops/min | 7 | 5 | 6 | 210 | Ultrasonic leak detection |
Figure 5. Structural comparison of FMEA and SMEA, with Root Cause Analysis (RCA) contrasted against Root Success Analysis (RSA).
4.5. Root Success Analysis (RSA)
Root Success Analysis complements Root Cause Analysis. Rather than investigating why an asset failed, RSA examines why the highest-performing assets consistently achieve optimal outcomes under comparable conditions, drawing on positive deviance methodology
| [20] | Sternin, J., Choo, R. The Power of Positive Deviance. Harvard Business Review. 2000, 78(1), 14-15. |
[20]
and on the “bright spots” logic of behavioural change
| [23] | Heath, C., Heath, D. Switch: How to Change Things When Change Is Hard. New York: Broadway Books; 2010. |
[23]
. Where RCA follows a causal chain downward, RSA investigates upward to identify replicable patterns of excellence. RCA generates corrective actions; RSA generates systemic capability. The two are complementary. Because RSA depends on personnel candidly reporting how work actually succeeds, its effectiveness presupposes the conditions of psychological safety described by Edmondson
| [17] | Edmondson, A. C. The Fearless Organization. Hoboken, NJ: John Wiley & Sons; 2019. |
[17]
.
5. SMART Operationalization of the Framework
A recurring criticism of conceptual frameworks is that they resist practical implementation. To address this directly, each PSC construct is operationalized against the SMART criteria, Specific, Measurable, Applicable, Realistic, and Time-bound, in
Table 6. This structure converts the framework from philosophy into an implementable management system compatible with the planning requirements of ISO 55001: 2024.
Table 6. SMART operationalization of the Potential Success Curve framework.
Criterion | Application to the PSC Framework |
Specific | The Golden Spot defines exact, asset-specific parameter bands (e.g., bearing temperature 45-65°C, vibration <2.5 mm/s). SMEA specifies the precise conditions that sustain value. Ambiguity is eliminated by requiring numeric thresholds for every success mode. |
Measurable | MTOP, MTTRg, Success Rate, and OPE are quantified metrics computed from time-series data already captured by most CMMS and historian systems. The Success Priority Number provides a measurable prioritization index for success conditions. |
Applicable | The framework operates on existing infrastructure: condition-monitoring sensors, CMMS/EAM platforms, and historian databases. It requires no new hardware, only a reconfiguration of what is monitored (success conditions) and how it is reported (toward the Golden Spot). |
Realistic | Adoption is incremental and complementary. Organizations retain RCM, TPM, and RBI while layering PSC on top. A single critical asset can serve as a pilot, making the framework realistic for resource-constrained operations. |
Time-bound | MTOP and MTTRg are inherently time-based. The implementation roadmap (Section 9) defines phased milestones over a 36-month horizon, aligning with the management-review cycles required by ISO 55001: 2024. |
6. Alignment with ISO 55000: 2024 and International Standards
For a maintenance framework to achieve real-world adoption, it must integrate with the international standards that govern asset management, inspection, and reliability practice. This section maps the PSC framework to the current standards landscape.
6.1. ISO 55000: 2024 and ISO 55001: 2024
The 2024 revision of the ISO 55000 series is the most consequential development for the PSC framework. The revised standards introduce four asset management outcomes, value, assurance, adaptability, and sustainability, and add an asset management maturity framework
| [4] | International Organization for Standardization. ISO 55000: 2024 and ISO 55001: 2024, Asset Management: Vocabulary, Overview, Principles and Requirements. Geneva: ISO; 2024. |
[4]
. The PSC framework operationalizes each of these outcomes directly. The Golden Spot and Success Rate operationalize value by defining and measuring the optimal value-delivery state. MTOP and MTTRg provide assurance by quantifying how reliably an asset sustains and returns to that state. Root Success Analysis builds adaptability by systematically identifying and replicating the conditions under which assets succeed across varying contexts. Overall Performance Excellence embeds sustainability by incorporating energy efficiency into the core performance metric. Furthermore, the new Section 4.5 of ISO 55001: 2024, “Asset management decision-making and value,” and the simplified Strategic Asset Management Plan (SAMP) provide a natural governance home for the PSC metrics, which can populate the SAMP as concrete, value-oriented objectives. The newly published ISO 55013: 2024 guidance on data management supports the data infrastructure that the Golden Spot requires.
6.2. API Standards
In the oil, gas, and process industries, API standards govern inspection and integrity. The PSC framework complements rather than competes with these. API 580 and API 581 (Risk-Based Inspection)
| [37] | American Petroleum Institute. API 580 and 581 Risk-Based Inspection. Washington, DC: API. |
[37]
determine inspection priority based on probability and consequence of failure; PSC Golden Spot parameters define what optimal operation looks like between RBI-scheduled inspections, providing continuous performance assurance alongside periodic integrity assessment. API 689 (aligned with ISO 14224) governs the collection of reliability and maintenance data; the MTOP and Success Rate metrics extend this data model with success-oriented fields, enabling organizations to capture not only time-to-failure but time-in-optimal-performance. The framework therefore enriches existing API-compliant data architectures rather than displacing them.
6.3. SAE, IEC, and ISO Reliability Standards
SAE JA1011 and JA1012 define the evaluation criteria for RCM processes
| [29] | SAE International. JA1011 Evaluation Criteria for RCM Processes and JA1012 A Guide to the RCM Standard. Warrendale, PA: SAE. |
[29]
. The PSC framework is positioned as a complementary layer above an RCM process that remains JA1011-compliant for safety-critical functions. IEC 60300 (dependability management) and IEC 60812 (FMEA)
| [27] | International Electrotechnical Commission. IEC 60300 Dependability Management and IEC 60812 Failure Mode and Effects Analysis. Geneva: IEC. |
[27]
provide the established analytical methods that SMEA extends rather than replaces. ISO 14224 (reliability data collection for the petroleum, petrochemical, and natural gas industries)
| [36] | International Organization for Standardization. ISO 14224 Petroleum, Petrochemical and Natural Gas Industries: Collection and Exchange of Reliability and Maintenance Data. Geneva: ISO. |
[36]
and ISO 13374 (condition monitoring and diagnostics)
| [38] | International Organization for Standardization. ISO 13374 Condition Monitoring and Diagnostics of Machines. Geneva: ISO. |
[38]
provide the data and monitoring foundations on which Golden Spot tracking is built.
Table 7 summarizes these relationships.
Table 7. Alignment of the PSC framework with international standards.
Standard | Domain | PSC Integration |
ISO 55000/55001: 2024 | Asset management system | PSC metrics operationalize the four outcomes (value, assurance, adaptability, sustainability) and populate the SAMP |
ISO 55013: 2024 | Asset data management | Provides the data-governance basis for Golden Spot parameter capture |
API 580 / 581 | Risk-Based Inspection | RBI sets inspection priority; PSC defines optimal operation between inspections |
API 689 / ISO 14224 | Reliability data collection | Extended with MTOP and Success Rate success-oriented data fields |
SAE JA1011 / JA1012 | RCM evaluation criteria | PSC layers above a JA1011-compliant RCM process for critical functions |
IEC 60300 / 60812 | Dependability; FMEA | SMEA extends the FMEA method with success-condition analysis |
ISO 13374 | Condition monitoring | Provides the monitoring architecture for real-time Golden Spot tracking |
7. Enablement Through Emerging Technologies
The PSC framework was not practical at scale in earlier decades because continuously defining, monitoring, and sustaining an asset-specific Golden Spot demanded data and computation that did not exist. The convergence of four technologies in the Industry 4.0 and emerging Industry 5.0 era now makes the framework operationally feasible.
7.1. Digital Twins
A digital twin is a continuously updated virtual model of a physical asset. Digital twins are the ideal technological embodiment of the Golden Spot: the twin defines “what optimal looks like” and enables real-time comparison between actual and ideal performance. Where the Golden Spot is a conceptual target, the digital twin is its computational instantiation. Publications on digital twin technology in infrastructure management grew approximately 80% between 2019 and 2024
| [40] | ResearchGate. Exploring the Impact of Digital Twin Technology in Infrastructure Management. 2024. |
[40]
, and the technology is now mature enough to model the multi-parameter performance envelopes that the Golden Spot requires. Reported industrial deployments indicate that comprehensive digital-twin predictive-maintenance programs can achieve 50 to 70% reductions in unplanned downtime, with initial investments of $200,000 to $600,000 per program generating $1.2 to $3.5 million in annual savings and reaching positive return within 18 to 36 months
| [40] | ResearchGate. Exploring the Impact of Digital Twin Technology in Infrastructure Management. 2024. |
[40]
. These figures align closely with the value-realization horizon of the PSC implementation roadmap.
7.2. Artificial Intelligence and Machine Learning
AI and machine learning enable three capabilities essential to the framework. First, unsupervised learning can discover the natural Golden Spot of an asset from historical data, identifying the parameter combinations associated with peak performance without requiring exhaustive manual specification. Second, supervised models can predict departure from the Golden Spot (Point S) earlier and more reliably than threshold alarms, extending the restoration window. Third, AI reframes Remaining Useful Life prediction from “when will it fail?” to “how long can this asset sustain optimal performance?”, which is the precise question the MTOP metric answers. Root Success Analysis is itself a pattern-recognition problem well suited to machine learning, which can identify the operational signatures that distinguish best-performing assets.
7.3. Industrial Internet of Things and Edge Analytics
The Industrial Internet of Things (IIoT) provides the continuous sensor streams required to compute Success Rate in real time. Low-cost retrofit sensors make even legacy assets monitorable, with sensor costs of hundreds of dollars against asset-replacement costs of millions
| [41] | IndustryWeek. Strategic Retrofitting: Older Machines Get an IIoT Update. 2021. |
[41]
. Edge analytics enable Golden Spot deviation to be detected at the asset rather than after data transfer, reducing the latency between Success Departure and intervention, and thereby reducing MTTRg. This democratizes the framework: organizations need not replace assets to adopt PSC, only instrument them.
7.4. Industry 4.0, Industry 5.0, and the Human Dimension
Industry 4.0 supplies the cyber-physical infrastructure for the framework, while the emerging Industry 5.0 paradigm, with its emphasis on human-centricity, resilience, and sustainability, aligns precisely with the PSC philosophy. The framework’s success-oriented language is inherently more motivating for the human workforce than failure-centric framing, supporting the people-involvement requirements newly formalized in ISO 55012: 2024. By positioning technicians as cultivators of success rather than preventers of failure, the framework addresses the cultural and competence dimensions that determine whether technology investments deliver returns.
These four technology enablers, digital twins, AI/ML, IIoT, and the Industry 4.0/5.0 ecosystem, do not alter the fundamental positioning of the PSC framework relative to established methodologies. Rather, they increase the operational feasibility of constructs that would have required prohibitive manual effort in earlier decades, and they strengthen the business case for adoption by making the ROI of success-oriented monitoring quantifiable. The relationship between the PSC framework and the established methodological landscape it complements is clarified in Section 8.
8. Relationship to Existing Frameworks and Boundaries of Application
The PSC framework is a complementary layer, not a competing methodology. Organizations can adopt it without abandoning RCM, TPM, or RBI. RCM continues to govern safety-critical failure analysis while PSC optimizes performance of the same assets; TPM’s OEE extends naturally into MTOP and OPE; and RBI inspection priorities are complemented by Golden Spot operational targets.
Equally important is clarity about where failure-centric analysis remains essential. The framework does not replace failure analysis in four scenarios: (a) safety-critical applications where failure consequences include fatality or environmental catastrophe, in which FMEA, fault tree analysis, and consequence-based RCM remain indispensable; (b) regulatory and compliance contexts that mandate specific failure methodologies, such as API 580/581 and MSG-3; (c) assets with known degradation mechanisms approaching design limits, where real metallurgical degradation cannot be reframed away; and (d) post-incident investigation, where Root Cause Analysis remains the appropriate tool. The recommended posture is success-oriented thinking as the default, with failure-oriented analysis reserved for these specific scenarios. Most mature organizations will run both perspectives in parallel.
9. Supporting Evidence and Industrial Business Impact
While no organization has explicitly adopted the PSC framework, global case studies illustrate the outcomes achievable through proactive, performance-oriented maintenance. These organizations used traditional tools; their results are cited as evidence of the trajectory toward success-oriented thinking that PSC formalizes, not as validation of the framework itself.
Table 8 summarizes representative outcomes.
Table 8. Global case studies demonstrating outcomes of proactive maintenance philosophies.
Organization | Region | Key Result | Method Used | Ref. |
Shell / C3 AI | Global | 20% downtime reduction | AI predictive; 15M predictions/day | | [24] | C3 AI. The Scale of Shell’s Global AI Predictive Maintenance Program. Available from: https://c3.ai (accessed 25 March 2025). |
[24] |
SNCF | France | 66% fewer breakdowns | Condition monitoring, 1,100+ trains | |
Saudi Aramco | Middle East | 30% maintenance cost cut | IoT sensors, Khurais field | | [26] | Aramco. Digitalization in the Oil & Gas Industry. Available from: https://www.aramco.com (accessed 25 March 2025). |
[26] |
Petrobras | Brazil | $154M digital twin savings | Digital twins, 11 refineries | | [28] | SAP. Intelligent Asset Management for Petrobras. SAP News Center; 2024. |
[28] |
The business case operates at three levels. At the enterprise level, Siemens’ 2024 analysis found that the world’s 500 largest companies lose $1.4 trillion annually to unplanned downtime, equivalent to 11% of revenues
| [30] | Siemens. The True Cost of Downtime 2024: A Comprehensive Analysis. Munich: Siemens; 2024. |
[30]
. The U.S. Department of Energy documented maintenance cost stratification from $18 per horsepower per year (reactive) to $6 (fully proactive), a 67% reduction
| [31] | U.S. Department of Energy. Operations & Maintenance Best Practices. Federal Energy Management Program; 2010. |
[31]
. At the sector level, the global predictive maintenance market, valued at approximately $14.3 billion in 2025, is projected to reach roughly $98 billion by 2033
| [32] | Straits Research. Predictive Maintenance Market Trends 2024. Market Report; 2024. |
[32]
, while the digital twin market is forecast to grow from about $35.8 billion in 2025 to $328.5 billion by 2033 at a compound annual growth rate above 31%
| [42] | Grand View Research and industry deployment analyses on digital twin and predictive maintenance market size and return on investment. 2025-2026. |
[42]
. This sustained capital flow toward the proactive, data-driven orientation that PSC formalizes confirms that the framework addresses a live and growing industrial priority rather than a theoretical one.
At the macroeconomic and policy level, the framework speaks directly to the infrastructure-investment challenge. With a documented $3.7 trillion U.S. infrastructure gap
| [33] | American Society of Civil Engineers. 2025 Infrastructure Report Card. Washington, DC: ASCE; 2025. |
[33]
and aging asset fleets across every industrial sector globally, a paradigm that extends asset life rather than defaulting to replacement carries significant economic and sustainability implications. Because Overall Performance Excellence embeds energy efficiency, fleet-wide adoption would contribute measurably to industrial decarbonization, aligning the framework with the net-zero commitments that motivated the ISO 55001: 2024 revision. The success-oriented framing also reshapes workforce engagement, an increasingly binding constraint as experienced maintenance personnel retire, by positioning maintenance as a value-creating profession rather than a cost-containment function.
10. Application to Aging and Legacy Assets
The framework may deliver its greatest value for aging assets, where failure-focused analysis can become counterproductive. When an asset is old, failure-centric analysis tends toward a single conclusion: replacement. This can create a self-fulfilling prophecy in which aging assets receive diminished optimization investment and consequently deteriorate faster. A success-oriented approach asks instead what optimal performance looks like for the asset at its current life stage. Strategic life extension delivers $2 to $5 million in cost avoidance per system while enabling 7 to 10 years of additional operation
| [34] | TXOne Networks. Beyond Replacement: Strategic Asset Life Extension. White Paper; 2024. |
[34]
, and the IAEA estimates that extending the global nuclear fleet’s lifetime by 10 years would add 26,000 TWh of low-carbon electricity
| [35] | International Atomic Energy Agency. Nuclear Power Plant Life Extensions Enable Clean Energy Transition. Vienna: IAEA; 2024. |
[35]
. Digital twins, IIoT retrofitting, and AI-based remaining-useful-life modeling make success-oriented management of legacy assets practical at a fraction of replacement cost.
11. Implementation Roadmap
Adoption follows a phased, time-bound roadmap aligned with the management-review cycles of ISO 55001: 2024, summarized in
Table 9.
Table 9. Phased implementation roadmap for the PSC framework.
Phase | Timeline | Key Activities | Deliverables |
1. Assess & Envision | Months 1-3 | Baseline maturity per ISO 55001; classify assets; define Golden Spot for top assets; first RSA | Maturity baseline; Golden Spot profiles |
2. Build Foundation | Months 3-9 | Configure CMMS/EAM and historian; deploy IIoT sensors; train teams in success vocabulary | Instrumented assets; trained workforce |
3. Digital Enablement | Months 9-18 | Build digital twins of optimal states; AI departure detection; SMEA documentation | Digital twins live; SMEA records |
4. Optimize & Scale | Months 18-36 | Transition KPIs (MTBF→MTOP); scale positive-deviance patterns fleet-wide; embed continuous RSA | Full KPI transition; embedded culture |
12. Discussion
12.1. Contributions
This article makes four contributions. First, it situates a success-oriented maintenance framework within the lineage of historic management breakthroughs, clarifying both its intellectual basis and its likely adoption pattern. Second, it operationalizes the framework against SMART criteria, converting philosophy into an implementable management system. Third, it maps the framework explicitly to ISO 55000: 2024 and the API, SAE, IEC, and ISO reliability standards, demonstrating compatibility with existing governance. Fourth, it shows how digital twins, AI, and the IIoT make the framework practical in modern operating environments and quantifies the potential industrial business impact.
12.2. Limitations and Future Research
First, the novel constructs have not been empirically validated; while their individual foundations are well established, the combined framework requires field testing, ideally a controlled pilot comparing failure-framed and success-framed teams on identical equipment. Second, the psychological evidence for reframing has not been tested in maintenance-specific settings. Third, defining the Golden Spot requires asset-specific expertise and data quality that may not exist for all assets. Fourth, the SMEA Success Priority Number scoring requires cross-industry validation of its inter-rater reliability and predictive accuracy. Fifth, the cited case studies used traditional tools and illustrate the trajectory toward success-oriented thinking rather than validating PSC directly.
The future research agenda encompasses five specific empirical pathways. First, a randomized controlled pilot study should compare maintenance teams using failure-framed tools against teams using the PSC framework on operationally identical equipment, measuring MTOP, MTTRg, SR, OPE, and organizational behavior outcomes over a minimum 4-12-month period. Second, a cross-industry SPN validation study should assess inter-rater reliability and scoring consistency of the SMEA methodology across at least three industry sectors, using the pump example in this article as the anchor case. Third, longitudinal MTOP tracking should be conducted across diverse asset types, including heat exchangers, compressors, transformers, and rotating equipment, to establish baseline benchmarks analogous to the MTBF norms that exist in the RCM literature. Fourth, qualitative research using structured interviews and ethnographic observation should measure how maintenance technicians and engineers respond to success-oriented versus failure-oriented framing in their daily cognitive processes and decision-making. Fifth, a digital-twin integration study should demonstrate the computational implementation of the Golden Spot as a real-time model in an operational industrial environment and quantify the MTTRg improvement achievable through AI-driven departure prediction. Collaborators from industry and academia are invited to engage in any of these pathways.
13. Conclusions
This article has presented the Potential Success Curve as a complementary, success-oriented evolution of Reliability-Centered Maintenance, and has demonstrated its practical applicability through SMART operationalization, explicit alignment with ISO 55000: 2024 and international reliability standards, and enablement by digital twins, artificial intelligence, and the Industrial Internet of Things. The framework belongs to a recognizable lineage of management breakthroughs, from TPM to Lean to Six Sigma, each of which reframed industrial practice and was ultimately adopted as standard.
The framework does not invalidate RCM, TPM, or RBI, which remain essential for safety-critical applications and regulatory compliance. Rather, it adds a complementary layer that operationalizes the value, assurance, adaptability, and sustainability outcomes at the heart of modern asset management. With $1.4 trillion lost annually to unplanned downtime and a multi-trillion-dollar global infrastructure gap, the economic and sustainability case for evolving maintenance philosophy is compelling. The novel constructs require empirical validation, and the author welcomes collaborative efforts to test them in operational environments. The question is no longer whether maintenance philosophy should evolve beyond exclusive failure-centricity, but how quickly the industry will operationalize the shift from preventing failure to sustaining excellence.
Abbreviations
PSC | Potential Success Curve |
RCM | Reliability-Centered Maintenance |
MTOP | Mean Time of Optimal Performance |
MTTRg | Mean Time to Restore Golden Spot |
SR | Success Rate |
OPE | Overall Performance Excellence |
SMEA | Success Mode and Effects Analysis |
RSA | Root Success Analysis |
SPN | Success Priority Number |
FMEA | Failure Mode and Effects Analysis |
MTBF | Mean Time Between Failures |
MTTR | Mean Time to Repair |
RCA | Root Cause Analysis |
OEE | Overall Equipment Effectiveness |
TPM | Total Productive Maintenance |
TQM | Total Quality Management |
FRAM | Functional Resonance Analysis Method |
RBI | Risk-Based Inspection |
SAMP | Strategic Asset Management Plan |
IIoT | Industrial Internet of Things |
AI | Artificial Intelligence |
ML | Machine Learning |
RUL | Remaining Useful Life |
CMMS | Computerized Maintenance Management System |
EAM | Enterprise Asset Management |
ESG | Environmental, Social, and Governance |
IAEA | International Atomic Energy Agency |
Acknowledgments
The author acknowledges the foundational contributions of Nowlan, Heap, Moubray, Nakajima, and Hollnagel, whose work made this evolution possible, and the global community of reliability practitioners advancing predictive maintenance, digital twins, and asset performance optimization.
Author Contributions
Irete Daniel Olorunfemi: Conceptualization, Formal Analysis, Investigation, Methodology, Visualization, Writing – original draft, Writing – review & editing
Data Availability Statement
The data supporting the outcome of this research work has been reported in this manuscript.
Conflicts of Interest
The author declares no conflicts of interest.
References
| [1] |
HBK World. Creating Initial Scheduled Maintenance Plans for Aircraft, MSG-3. Available from:
https://www.hbkworld.com
(accessed 15 March 2025).
|
| [2] |
Smith, A. M. Reliability-Centered Maintenance. New York: McGraw-Hill; 1993.
|
| [3] |
Nowlan, F. S., Heap, H. F. Reliability-Centered Maintenance. Report AD-A066579. Washington, DC: U.S. Department of Defense; 1978.
|
| [4] |
International Organization for Standardization. ISO 55000: 2024 and ISO 55001: 2024, Asset Management: Vocabulary, Overview, Principles and Requirements. Geneva: ISO; 2024.
|
| [5] |
Kahneman, D., Tversky, A. Prospect Theory: An Analysis of Decision under Risk. Econometrica. 1979, 47(2), 263-291.
https://doi.org/10.2307/1914185
|
| [6] |
Cooperrider, D. L., Srivastva, S. Appreciative Inquiry in Organizational Life. In Research in Organizational Change and Development. Greenwich, CT: JAI Press; 1987, pp. 129-169.
|
| [7] |
Peerally, M. F., Carr, S., Wainwright, J., Berwick, D. The Problem with FMEA: Too Little for Too Much? BMJ Quality & Safety. 2012, 21(7), 604-611.
https://doi.org/10.1136/bmjqs-2011-000760
|
| [8] |
Schenkelberg, F. Why Can’t We Shake Off MTBF? Accendo Reliability. Available from:
https://accendoreliability.com
(accessed 20 March 2025).
|
| [9] |
Accendo Reliability. MTBF of a Human. Available from:
https://accendoreliability.com/mtbf-of-a-human/
(accessed 20 March 2025).
|
| [10] |
Peerally, M. F., et al. The Problem with Root Cause Analysis. BMJ Quality & Safety. 2017, 26(5), 417-422.
https://doi.org/10.1136/bmjqs-2016-005511
|
| [11] |
Snowden, D. Root ‘Cause’ & Complexity. The Cynefin Co. Available from:
https://thecynefin.co
(accessed 22 March 2025).
|
| [12] |
Todd, J. Q. Challenging the P-F Curve. Maintenance World. 2023. Available from:
https://maintenanceworld.com
(accessed 22 March 2025).
|
| [13] |
Plucknette, D. Completing the Curve. Reliabilityweb. Available from:
https://reliabilityweb.com
(accessed 22 March 2025).
|
| [14] |
Van Woerkom, M., Meyers, M. C. Strengths Use and Deficit Correction in Organizations. European Journal of Work and Organizational Psychology. 2016, 26(2), 195-207.
https://doi.org/10.1080/1359432X.2016.1193010
|
| [15] |
Miglianico, M., et al. Strengths Use in Organizations. Frontiers in Psychology. 2020, 13, 659046.
https://doi.org/10.3389/fpsyg.2022.659046
|
| [16] |
Bushe, G. R. Appreciative Inquiry: Theory and Critique. In The Routledge Companion to Organizational Change. London: Routledge; 2012, pp. 87-103.
|
| [17] |
Edmondson, A. C. The Fearless Organization. Hoboken, NJ: John Wiley & Sons; 2019.
|
| [18] |
Hollnagel, E. Safety-I and Safety-II: The Past and Future of Safety Management. Farnham: Ashgate; 2014.
|
| [19] |
Hollnagel, E. FRAM: The Functional Resonance Analysis Method. Farnham: Ashgate; 2012.
|
| [20] |
Sternin, J., Choo, R. The Power of Positive Deviance. Harvard Business Review. 2000, 78(1), 14-15.
|
| [21] |
Nakajima, S. Introduction to TPM: Total Productive Maintenance. Cambridge, MA: Productivity Press; 1988.
|
| [22] |
Etchison, D. M. The Extended D-I-P-F Curve. 2016.
|
| [23] |
Heath, C., Heath, D. Switch: How to Change Things When Change Is Hard. New York: Broadway Books; 2010.
|
| [24] |
C3 AI. The Scale of Shell’s Global AI Predictive Maintenance Program. Available from:
https://c3.ai
(accessed 25 March 2025).
|
| [25] |
SNCF Group. A Leader in Predictive Maintenance. Available from:
https://www.groupe-sncf.com
(accessed 25 March 2025).
|
| [26] |
Aramco. Digitalization in the Oil & Gas Industry. Available from:
https://www.aramco.com
(accessed 25 March 2025).
|
| [27] |
International Electrotechnical Commission. IEC 60300 Dependability Management and IEC 60812 Failure Mode and Effects Analysis. Geneva: IEC.
|
| [28] |
SAP. Intelligent Asset Management for Petrobras. SAP News Center; 2024.
|
| [29] |
SAE International. JA1011 Evaluation Criteria for RCM Processes and JA1012 A Guide to the RCM Standard. Warrendale, PA: SAE.
|
| [30] |
Siemens. The True Cost of Downtime 2024: A Comprehensive Analysis. Munich: Siemens; 2024.
|
| [31] |
U.S. Department of Energy. Operations & Maintenance Best Practices. Federal Energy Management Program; 2010.
|
| [32] |
Straits Research. Predictive Maintenance Market Trends 2024. Market Report; 2024.
|
| [33] |
American Society of Civil Engineers. 2025 Infrastructure Report Card. Washington, DC: ASCE; 2025.
|
| [34] |
TXOne Networks. Beyond Replacement: Strategic Asset Life Extension. White Paper; 2024.
|
| [35] |
International Atomic Energy Agency. Nuclear Power Plant Life Extensions Enable Clean Energy Transition. Vienna: IAEA; 2024.
|
| [36] |
International Organization for Standardization. ISO 14224 Petroleum, Petrochemical and Natural Gas Industries: Collection and Exchange of Reliability and Maintenance Data. Geneva: ISO.
|
| [37] |
American Petroleum Institute. API 580 and 581 Risk-Based Inspection. Washington, DC: API.
|
| [38] |
International Organization for Standardization. ISO 13374 Condition Monitoring and Diagnostics of Machines. Geneva: ISO.
|
| [39] |
Prosci. Kotter’s Change Management Theory: Explanation and Applications. Available from:
https://www.prosci.com
(accessed 28 March 2025).
|
| [40] |
ResearchGate. Exploring the Impact of Digital Twin Technology in Infrastructure Management. 2024.
|
| [41] |
IndustryWeek. Strategic Retrofitting: Older Machines Get an IIoT Update. 2021.
|
| [42] |
Grand View Research and industry deployment analyses on digital twin and predictive maintenance market size and return on investment. 2025-2026.
|
Cite This Article
-
APA Style
Olorunfemi, I. D. (2026). A Success-Centric Evolution of Reliability-Centered Maintenance in Modern Asset Management. Science, Technology & Public Policy, 10(2), 20-34. https://doi.org/10.11648/j.stpp.20261002.11
 Copy
|
Copy
|
 Download
ACS Style
Olorunfemi, I. D. A Success-Centric Evolution of Reliability-Centered Maintenance in Modern Asset Management. Sci. Technol. Public Policy 2026, 10(2), 20-34. doi: 10.11648/j.stpp.20261002.11
Copy
|
Download
AMA Style
Olorunfemi ID. A Success-Centric Evolution of Reliability-Centered Maintenance in Modern Asset Management. Sci Technol Public Policy. 2026;10(2):20-34. doi: 10.11648/j.stpp.20261002.11
Copy
|
Download
-
@article{10.11648/j.stpp.20261002.11,
  author = {Irete Daniel Olorunfemi},
  title = {A Success-Centric Evolution of Reliability-Centered Maintenance in Modern Asset Management},
  journal = {Science, Technology & Public Policy},
  volume = {10},
  number = {2},
  pages = {20-34},
  doi = {10.11648/j.stpp.20261002.11},
  url = {https://doi.org/10.11648/j.stpp.20261002.11},
  eprint = {https://article.sciencepublishinggroup.com/pdf/10.11648.j.stpp.20261002.11},
  abstract = {Reliability-Centered Maintenance (RCM) has served as the dominant industrial maintenance philosophy for nearly five decades, delivering substantial gains in safety, availability, and cost control. However, its core vocabulary, built around Failure Mode, Mean Time Between Failures, and the Potential-to-Functional Failure curve, frames organizational cognition around breakdown rather than performance excellence. This article proposes a complementary, success-oriented framework, the Potential Success Curve (PSC), and demonstrates its practical alignment with contemporary asset management practice. Methodologically, the study employs an integrative cross-disciplinary review with deductive construct development, comparative standards analysis, and worked operational examples. Grounded in Prospect Theory, Appreciative Inquiry, Safety-II, and the lineage of transformative management methodologies including Total Productive Maintenance (TPM), Lean, Total Quality Management, and Six Sigma, the framework introduces several novel constructs: the Golden Spot (an asset’s optimal performance envelope), Mean Time of Optimal Performance (MTOP), Mean Time to Restore Golden Spot (MTTRg), Success Rate, Overall Performance Excellence (OPE), Success Mode and Effects Analysis (SMEA), and Root Success Analysis (RSA). A new D-I-S-G model extends the traditional D-I-P-F curve. The framework is operationalized through a SMART (Specific, Measurable, Applicable, Realistic, Time-bound) validation structure and is mapped explicitly to ISO 55000: 2024, ISO 55001: 2024, API 580/581, SAE JA1011, ISO 14224, and IEC 60300. The article further demonstrates how emerging technologies, including artificial intelligence, digital twins, and the Industrial Internet of Things, serve as practical enablers of the framework, and quantifies the potential impact on the industrial business landscape. While the proposed constructs require empirical validation, their theoretical foundations are individually well established, and the framework is positioned as a complementary layer that enhances rather than replaces established practice. The principal limitation of the study is the absence of primary empirical data; all proposed constructs are explicitly formulated as testable propositions, and the research agenda for field validation is set out in Section 12.2.},
 year = {2026}
}
Copy
|
Download
-
TY  - JOUR
T1  - A Success-Centric Evolution of Reliability-Centered Maintenance in Modern Asset Management
AU  - Irete Daniel Olorunfemi
Y1  - 2026/07/17
PY  - 2026
N1  - https://doi.org/10.11648/j.stpp.20261002.11
DO  - 10.11648/j.stpp.20261002.11
T2  - Science, Technology & Public Policy
JF  - Science, Technology & Public Policy
JO  - Science, Technology & Public Policy
SP  - 20
EP  - 34
PB  - Science Publishing Group
SN  - 2640-4621
UR  - https://doi.org/10.11648/j.stpp.20261002.11
AB  - Reliability-Centered Maintenance (RCM) has served as the dominant industrial maintenance philosophy for nearly five decades, delivering substantial gains in safety, availability, and cost control. However, its core vocabulary, built around Failure Mode, Mean Time Between Failures, and the Potential-to-Functional Failure curve, frames organizational cognition around breakdown rather than performance excellence. This article proposes a complementary, success-oriented framework, the Potential Success Curve (PSC), and demonstrates its practical alignment with contemporary asset management practice. Methodologically, the study employs an integrative cross-disciplinary review with deductive construct development, comparative standards analysis, and worked operational examples. Grounded in Prospect Theory, Appreciative Inquiry, Safety-II, and the lineage of transformative management methodologies including Total Productive Maintenance (TPM), Lean, Total Quality Management, and Six Sigma, the framework introduces several novel constructs: the Golden Spot (an asset’s optimal performance envelope), Mean Time of Optimal Performance (MTOP), Mean Time to Restore Golden Spot (MTTRg), Success Rate, Overall Performance Excellence (OPE), Success Mode and Effects Analysis (SMEA), and Root Success Analysis (RSA). A new D-I-S-G model extends the traditional D-I-P-F curve. The framework is operationalized through a SMART (Specific, Measurable, Applicable, Realistic, Time-bound) validation structure and is mapped explicitly to ISO 55000: 2024, ISO 55001: 2024, API 580/581, SAE JA1011, ISO 14224, and IEC 60300. The article further demonstrates how emerging technologies, including artificial intelligence, digital twins, and the Industrial Internet of Things, serve as practical enablers of the framework, and quantifies the potential impact on the industrial business landscape. While the proposed constructs require empirical validation, their theoretical foundations are individually well established, and the framework is positioned as a complementary layer that enhances rather than replaces established practice. The principal limitation of the study is the absence of primary empirical data; all proposed constructs are explicitly formulated as testable propositions, and the research agenda for field validation is set out in Section 12.2.
VL  - 10
IS  - 2
ER  -
Copy
|
Download






 Share This Article
 Twitter
 Linked In
 Facebook