1. Introduction
In the contemporary global economy, the digital transformation of financial services has become a critical driver of efficiency, convenience, and financial inclusion (Vavrová, 2024; Wani
et al., 2023). Among the key innovations is the adoption of mobile payment systems, which allow users to perform financial transactions using mobile devices. Globally, mobile payments have gained substantial traction, particularly in developing countries where access to traditional banking infrastructure remains limited
| [9] | Kavishemi, S., & Thavakumar, D. (2020). Impact of mobile banking applications usage on customers’ satisfacton for selected commercial in Manmunai North Division of Batticaloa District. Journal of Management Matters, 7(2), 39–51. |
[9]
. According to the GMSA, mobile money services reached over 1.6 billion registered accounts worldwide, with over USD 1.26 trillion transacted in 2022 alone, demonstrating their growing relevance in both formal and informal economies
. Mobile payment services offer consumers faster transaction speeds, greater convenience, and enhanced security. For governments, mobile payment systems facilitate easier collection of taxes and fees while helping to prevent fraud, money laundering, and tax evasion
| [2] | Bank of Tanzania. (2022). Annual report 2021/22.
https://www.bot.go.tz |
| [10] | Khoa, B. T. (2021). Digital touchpoints in fashion marketing: Comparing the roles of email, social media, and store experience. Asian Journal of Marketing, 15(4), 75–90. |
[2, 10]
.
In relation to this, Sub-Saharan Africa has emerged as a global leader in mobile financial services. The region accounted for nearly 70% of the world’s mobile money transaction volume in 2022, driven by high mobile phone penetration and innovative service models
. Countries such as Kenya, Uganda, and Ghana have experienced a digital financial revolution, largely through platforms like M-Pesa, MTN Mobile Money, and Airtel Money. These platforms have enhanced financial access for unbanked populations and catalyzed growth in small and medium-sized enterprises (SMEs) by offering secure and real-time payment alternatives
| [15] | Shauri, H., Mwakalobo, A., & Nnko, S. (2023). Digital consumer behavior in sub-Saharan Africa: Trends and implications. African Journal of Marketing Research, 15(2), 45–62. |
[15]
.
Tanzania has not lagged behind in this digital transformation. With over 35 million mobile money accounts and active service providers such as M-Pesa, Tigo Pesa, Airtel Money, and Halopesa, the mobile payment ecosystem in Tanzania has expanded significantly
. The government and financial regulators have supported this expansion through policies that promote interoperability and financial inclusion. SMEs, which contribute more than one-third to Tanzania’s GDP and provide a substantial share of employment
| [20] | United Republic of Tanzania (URT). (2021). National SME Development Policy Review Report. Ministry of Industry and Trade. |
[20]
, are increasingly adopting mobile payments for day-to-day transactions due to their convenience, accessibility, and enhanced security compared to cash handling.
Moreover, the Morogoro Municipal, as a rapidly urbanizing commercial hub in Tanzania, presents a compelling case for examining this shift in the use of mobile payment. Many SMEs in the area face operational challenges such as insecurity in handling cash, delayed payments, and lack of access to traditional banking services. Mobile payment solutions offer a potential remedy, yet the extent to which they are adopted and their perceived effectiveness remain insufficiently explored.
In addition to this, an empirical study showcased that the traditional cash-based system in Tanzania has been dominant for many decades. The reliance on cash payment systems exposes the National Payment System to several risks and challenges, such as theft, high holding costs, loss of revenues due to uncollected taxes, and limited access to and usage of financial services, particularly in rural areas
. Technological development has paved the way for minimizing the challenges of cash payment systems through fast payment options such as mobile payment methods. While in many European countries, technological development has brought changes in the payment ecosystem to the extent that the role of traditional cash has started to decline due to the growing prominence of fast payment solutions
| [3] | Boel, P. (2023). Payment systems–history and challenges. Sveriges Riksbank. Economic Review, 1, 51–66. |
[3]
, this is contrary to Tanzania, where cash payment systems have dominated the list of payment solutions
. This poses the question of why Tanzanians are skeptical about switching to mobile payment methods despite the increased availability of payment solutions such as merchant payment systems, which are almost available all over the country.
Therefore, this study seeks to assess mobile payment methods as alternatives to cash payments from the perspective of SMEs in Morogoro Municipal. It aims to examine adoption drivers, benefits, and barriers, thereby contributing to a deeper understanding of mobile finance in local enterprise contexts.
2. Literature Review
2.1. Empirical Review
Mobile payment switching intention in developing countries has received little attention from researchers
. For instance,
| [21] | Vavrová, K. (2024). Authenticity and saturation: Limits of social media engagement in fashion marketing. European Journal of Digital Communication, 11(3), 78–94. |
[21]
showed that SMEs in many developing countries consider mobile money payment services as a sustainable alternative to cash payment due to their potential benefits in propelling business growth. However, the study found that the use and adoption of mobile money payment by SMEs as an alternative to cash payment has generally been low. This incidence led the researcher to conduct a study to understand people’s opinions toward switching to mobile payment methods.
Kombe
researched mobile phone payments and the demand for cash in Tanzania. The study showed that despite the increased use of mobile phone transactions, cash is still preferred and used in Tanzania compared to mobile money payment methods. In 2023, Fin Scope Tanzania reported that 13% of Tanzanian adults have ever paid for goods and services through merchant payment channels such as mobile money payments, which are almost all over the country. The report further identified that only 3% of Tanzanians have used this merchant service for payment of goods only. These studies show low awareness and low use of mobile payment in purchasing goods, which is why the researcher wanted to assess and understand the extent of the use of mobile payment systems and identify factors that may influence switching to mobile payment methods.
Swiecka et al. al
| [16] | Swiecka, B., Terefenko, P., & Paprotny, D. (2021). Transaction factors’ influence on the choice of payment by Polish consumers. Journal of Retailing and Consumer Services.
http://www.elsevier.com/locate/jretconser |
[16]
researched factors influencing the choice of payment by Polish consumers. The study showed that complexity and diversity are the factors influencing the selection of payment methods. However, despite the development of innovative forms of payment methods in Poland, traditional forms of payment, especially cash payment systems, are more preferred.
Maganga
studied factors influencing the adoption of mobile money services in Morogoro Municipal and Morogoro district, Tanzania. The study showed that consumer attitudes with regard to perceived ease of use, perceived usefulness, and perceived trust had a significant effect on the adoption of mobile money services, while perceived cost and perceived risk had no significant effect on the adoption of mobile money services. On the use of mobile money services, the study identified that mobile money services are mostly used by people in sending and receiving money, paying bills, and buying airtime.
Eriksson et. al
| [7] | Eriksson, N., Gökhan, A., & Stenius, M. (2021). A qualitative study of consumer resistance to mobile payments for in-store purchases. Procedia Computer Science, 181, 634–641.
https://doi.org/10.1016/j.procs.2021.01.212
ResearchGate SCISPACE |
[7]
conducted a qualitative study on consumer resistance to mobile payment in Finland. The study showed that despite the increasing adoption of mobile payment, especially person-to-person payment, there are factors hindering the adoption of mobile payment such as perceived security and privacy, along with perceived risk of reliance on mobile phones, and a lack of perceived relative advantage to other payment options.
2.2. Theoretical Framework
This study was governed by the Push-Pull-Mooring (PPM) theory of migration to explore factors that could influence switching intention to mobile payment methods among small and medium entrepreneurs in Morogoro Municipal, Tanzania. The PPM is a unifying framework of consumer switching behaviour from one service provider to another
| [23] | Widodo, W., Palullungan, D., & Syairudin, B. (2019). Implementing PPM framework to customer switching behaviour in dual-channel service supply chain. Journal of Physics: Conference Series, 1367(1), 012043.
https://doi.org/10.1088/1742-6596/1367/1/012043 |
[23]
. Switching intention to mobile payment is viewed as consumers forgoing their current payment method (cash payment) and choosing an alternative method (mobile payment method)
. The adoption of the theory could assist the researcher in identifying the switching intention of small and medium entrepreneurs to the mobile payment method. The theory considers the Push, Pull, and Mooring effects on switching intention.
Push Factors: these are the negative aspects of the current cash payment system that compel SMEs to consider alternatives. Examples include the risk of theft, high holding costs, and limited access to financial services. Push factors may include dissatisfaction with current services or products, service failure, pricing issues, low trust, and perceived security
.
Pull Factors: these are the attractive aspects of mobile payment methods that draw SMEs toward them. These factors may include convenience, time-saving benefits, ease of use, and the relative advantage of mobile payments over cash. Whereas
mooring factors involve individual, social, and cultural factors that either facilitate or hinder the switching decision. These factors may include awareness of mobile payment options, trust in the system, privacy concerns, security considerations, and switching costs.
2.3. Conceptual Framework
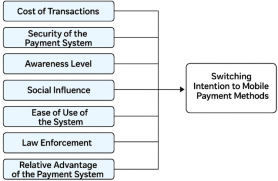
The study incorporated several key variables and their interrelationships, including both dependent and independent variables. The Independent variables include the cost of transactions, security of the payment system, awareness level, social influence, ease of use of the system, law enforcement, and the relative advantage of the payment system, while the dependent variable was switching intention to mobile payment methods.
Figure 1. Conceptual Framework.
The conceptual framework of this study posits that the switching intention of SMEs to mobile payment methods is influenced by several key independent variables: cost of transactions, security of the payment system, awareness level, social influence, ease of use, law enforcement, and the relative advantage of the system. These factors interact to shape SMEs’ willingness to transition from traditional cash-based transactions to mobile payment solutions. For instance, lower transaction costs, higher perceived security, greater awareness, and social endorsement can positively influence adoption. Similarly, ease of use and perceived advantages such as convenience and speed further enhance the appeal of mobile payments. Additionally, regulatory support and enforcement can play a facilitative role by encouraging or mandating digital adoption. Collectively, these variables determine the likelihood that SMEs in Morogoro Municipal will switch to mobile payment methods.
3. Methodology
3.1. Research Design
The study employed a descriptive research design to attempt and obtain information about the research execution. The descriptive research design has been employed because it allows exploration of situations while providing further information regarding the research topic. In that case, the descriptive research design was used to explore data regarding the extent of mobile payment methods among SMEs dealing with agricultural-based products in Morogoro Municipal, Tanzania. In side of research approach, the study employed a quantitative approach to collect information from small and medium entrepreneurs in Morogoro.
3.2. Population of Study
The target population for this study was small and medium entrepreneurs who deal with selling Agricultural products in the Kingalu market, Mawenzi market, and Fire market in Morogoro Municipal, Tanzania, and who possess mobile phones with mobile money accounts that can be used for transactions during the payment process. According to the Morogoro Municipal Council, there are approximately 1,000 registered small and medium-scale vendors across the three markets, the majority of whom are engaged in agri-business activities. Therefore, this study considered 1,000 individuals as the targeted population of the study.
3.3. Sample Size
In this study, the sample size was obtained by using a formula recommended by Yamane in 1967. The considered population was 1,000 small and Medium Entrepreneurs in Morogoro Municipal.
Yamane’s formula
Whereas: n = Sample size
N = Population
e = Probability of error (0.05)
=
=
=
n= 285.7
n= 286
Thus, the sample size in this study comprised 286 small and medium entrepreneurs in Morogoro Municipal.
3.4. Sampling Procedure
The probability sampling procedure, specifically simple random sampling, was used to obtain 286 small and medium entrepreneurs to be involved in the study. When the researcher arrived at the business area, the list of all small and medium entrepreneurs was provided by their leaders. Then, the list of small and medium entrepreneurs was arranged in alphabetical order given numbers. Thereafter, the numbers from the list of small and medium entrepreneurs were written in different pieces of paper and put in a jar, and after shaking the jar, a researcher started to pick the pieces of paper from the jar one by one until the required number was obtained; then all selected small and medium entrepreneurs were visited and asked to participate in the study. The main reason to apply the simple random sampling technique is to avoid bias in obtaining respondents to achieve the sample size. As
, stipulates that simple random sampling avoid biasness because every member in the population has an equal chance of being selected and included in the sample size.
3.5. Data Collection
The study collected primary data from 286 small and medium entrepreneurs. A questionnaire was applied as a tool for data collection. It was designed to include only closed-ended questions so as to guide a respondent to align on a limited view based on the topic only. The Likert scale of five options (strongly disagree, disagree, neutral, agree, and strongly agree) was used in the designed questionnaire to capture categorical data. Moreover, the questionnaire was researcher-administered, the reason behind to allow clarification of ambiguous or unclear questions and answers. In addition, Kobo Toolbox software was used in a survey to collect information to all 286 small and medium entrepreneurs.
3.6 Data Analysis
The captured data were analyzed descriptively, whereas frequency and percentages were generated from the findings. In addition, inferential analysis was employed by applying ordinal logistic regression to assess the influence of seven independent variables, including security, transaction costs, social efficiency, awareness, ease of use, law enforcement, and relative advantage, on switching intention as the dependent variable. It is important to note that the collected data were measured using ordinal Likert-scale responses. Therefore, ordinal logistic regression is appropriate when the dependent variable is categorical with a natural order but unknown intervals between categories
| [4] | Boone, H. N., & Boone, D. A. (2012). Analyzing Likert data. Journal of Extension, 50(2), Article 2TOT2. |
[4]
. The general form of the ordinal logistic regression model is:
log () = αj−β1X1−β2X2–β3X3
Where:
(Y) is the ordinal dependent variable representing switching intention,
(j) indexes the cumulative logit thresholds,
(\alpha_j) is the intercept for category (j),
Xs represent independent variables
X1 = security.
X 2 = cost transactions
X3 = Social efficacy
X4 = awareness
X 5 = ease of use
X6 = law enforcement
X7 = relative advantage
β 1, β 2, β3 are the regression coefficients estimating the effect of each predictor
The considered value of score was at the p-value of 0.05. The results of this inferential analysis provided insights into how improvements in these seven independent variables influence switching intention.
4. Study Findings and Discussion
4.1. Demographic Information
4.1.1. Distribution of Respondents
The study was conducted in Morogoro Municipal, Tanzania, whereby a total sample of 286 valid respondents was randomly selected from three markets with the following distribution: Kingalu market had 119 (41.6%) respondents, Mawenzi market had 91 (32.2%) respondents, and Fire market had 75 (26.2%) respondents. This implies that the Kingalu market has a larger number of small and medium entrepreneurs who sell Agricultural products because it is the largest market in the Morogoro Region, as shown in
Table 1.
Table 1. Distribution of respondents in the market.
DISTRIBUTION OF RESPONDENTS |
Description of Market | Frequency | Percent |
Kingalu | 119 | 41.6 |
Mawenzi | 92 | 32.2 |
Fire | 75 | 26.2 |
TOTAL | 286 | 100 |
4.1.2. Respondents’ Gender distribution
The information in
Table 2 shows that out of 286 respondents, 157 (54.9%) are male, while 129 (45.1%) are female. This implies that there is a larger number of males engaging in businesses of Agricultural products in Morogoro Municipal, Tanzania, as shown in
Table 2 below;
Table 2. Gender distribution of respondents.
GENDER DISTRIBUTION OF RESPONDENTS |
Description | Frequency | Percent |
Male | 157 | 54.9 |
Female | 129 | 45.1 |
TOTAL | 286 | 100 |
4.1.3. Age Distribution
In terms of the respondents’ ages, the results in
Table 3 show that 66.1% of respondents were between the ages of 36 and 53, of whom 159 (55.6%) were male, and 30 (10.5%) were female. This implies that a large number of small and medium entrepreneurs who deal with selling agricultural products in Morogoro Municipal are in the middle-age range of 36 to 53 years old.
Table 3. Age distribution of respondents.
AGE DISTRIBUTION OF RESPONDENTS |
Description | Frequency | Male | Female | Percent |
Age 18 to 35 | 91 | 31 | 60 | 31.8 |
Age 36 to 53 | 189 | 159 | 30 | 66.1 |
Age above 54 | 6 | 5 | 1 | 2.1 |
TOTAL | 286 | 195 | 91 | 100 |
4.1.4. Capital Range of SMEs
The question about the respondents’ capital size was asked to identify and qualify whether people who own and sell Agricultural products in those markets deserve to be called small and medium entrepreneurs. The classifications of the capital sizes were obtained from the classification done in 2016 by Financial Sector Deepening Trust (FSDT). The capital sizes for Micro, Small and Medium Enterprises (MSMEs) were categorized into three (3) main categories, i.e., 0-500,000 TZS, 500,000-999,999 TZS and 1,000,000 TZS and above.
Table 4 shows that 150 (52.4%) of respondents have a capital size ranging from 0 to 500,000 Tanzanian Shillings (TZS), while 70 (24.5%) of the respondents operate with a capital range between 500,000 to 1,000,000 TZS, and 66 (23.1%) of respondents operate with capital above 1,000,000 TZS.
This distribution suggests that slightly over half of the surveyed small and medium entrepreneurs who deal with agricultural-based products in Morogoro Municipal operate with relatively small capital investments. Approximately a quarter of SMEs have a capital base in the mid-range, while slightly less than a quarter operate with a more substantial capital investment. Thus, the capital size of small and medium entrepreneurs who own agricultural-based product SMEs in Morogoro Municipal, Tanzania, qualifies them to be called small and medium entrepreneurs due to their capital size. Moreover, these data provide context for understanding the financial capacity of these SMEs and their potential for growth and adoption of different payment methods.
Table 4. Size of Capital invested by respondents in the business.
CAPITAL SIZE INVESTED |
Capital range (Tshs) | Frequency | Percent |
Between 0 to 500,000 | 150 | 52.4 |
Between 500,000 to 1,000,000 | 70 | 24.5 |
Above 1,000,0000 | 66 | 23.1 |
TOTAL | 286 | 100 |
4.2. Mobile Money Account Ownership
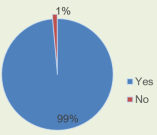
The study shows that out of 286 respondents, 282 (99%) owned a mobile money account, while 4 respondents (1%) did not own a mobile money account. This implies that the rate of mobile money account ownership among small and medium entrepreneurs who deal with agricultural-based businesses in Morogoro Municipal, Tanzania, is very high, as shown in
Figure 1. The study aligns with the study conducted by Global Findex in 2021, showing that 52 percent of adults in Tanzania have an account of any kind.
Figure 2. Mobile Money account ownership.
4.2.1. Ownership of Mobile Money Account Based on Mobile Network
The question regarding mobile money account ownership among different mobile network operators in Tanzania was examined.
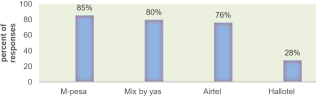
Figure 2 presents the percentage of mobile money account ownership based on different mobile networks. The study found that 85% of respondents own M-Pesa mobile money accounts, 80% of respondents own Mix by Yas (Tigo) mobile money accounts, 76% hold Airtel Money accounts, and 28% possess Halotel Money accounts. Additionally, the majority of respondents own multiple mobile money accounts. This implies that a large number of small and medium-sized business owners in Morogoro Municipal, Tanzania, manage multiple mobile money accounts. Besides, Vodacom, through its M-Pesa mobile money account, was found to be the leading mobile network operator, having the largest number of users with mobile money accounts at 85%, followed by Mix by Yas with 80% of mobile money account owners, then Airtel with 76%, and lastly Halotel with 28%. This result aligns with TCRA (2023), which shows M-Pesa leading, followed by Mixx by Yas, then Airtel Money, and then Halotel.
Figure 3. Mobile money account ownership among mobile network operators.
4.2.2. The Extent of Use of Mobile Payment Method Over Cash Payment Method Among Small and Medium Entrepreneurs
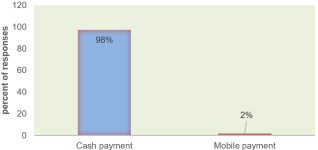
Figure 3 shows that, out of 286 respondents who were interviewed, 282 (98%) use traditional cash, while 4 respondents (2%) use mobile payment methods. This implies that a large number of small and medium-sized entrepreneurs who are dealing with agricultural products in Morogoro Municipal, Tanzania, prefer cash payment systems over mobile payment methods when buying goods. The study aligns with
and
, showing that despite the increased use of mobile phone transactions, cash is still preferred and used in Tanzania compared to mobile money payment methods.
Figure 4. Status of payment methods usage among respondents.
4.2.3. Extent of Use of Mobile Payment in the Payment of Services
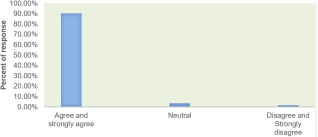
Figure 4 presents the percentage of mobile payment usage for various services. The collected data indicates that 90.21% of respondents agreed to use mobile payment methods for bill payments such as water and electricity, while 1.4% disagreed, and 8.39% remained neutral. This implies that a large number of small and medium-sized entrepreneurs (SMEs) in Morogoro Municipal, Tanzania, primarily use mobile payment methods for bill payments rather than purchasing goods. This study aligns with the study conducted by
, which showed that mobile money is mostly used for sending and receiving money, paying bills, and buying airtime.
Figure 5. State of use of mobile payment methods in payment of services among respondents.
4.2.4. Extent of Use of Mobile Money Payment Methods for Buying Airtime, Money Remittance and Storing Cash
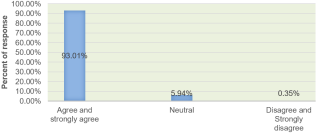
Figure 5 shows that 93% of respondents use mobile payment methods for buying airtime, money remittance, and storing cash, while 0.35% do not use mobile payment methods for these purposes, and 5.94% of respondents were neutral. This implies that most small and medium entrepreneurs who own SMEs and do business in Morogoro Municipal, Tanzania, mainly use mobile payment methods for buying airtime, remitting money, and storing cash. These results conform with an earlier study conducted by
which showed that mobile money is mostly used for sending and receiving money, paying bills, and buying airtime.
Figure 6. Extent of use of mobile money payment methods for buying airtime, money remittance and storing cash.
4.2.5. Extent of Use of Mobile Payment Methods in Purchasing Goods
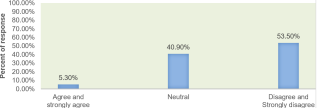
Figure 6 shows that 5.3% of respondents who were interviewed indicated that they use mobile payment methods for purchasing goods, but 53.5% of respondents indicated that they do not, while 49.9% of respondents were neutral. The result implies that the use of mobile money payment methods in purchasing goods is still low. This result aligns with earlier study done by the United Nations Capital Development Fund
| [19] | United Nations Capital Development Fund (UNCDF). (2021). Demand for digital financial services and Fintech in Tanzania. |
[19],
which showed that 4% of Tanzanians in 2021 and 3% in 2023, respectively, used digital merchant payment systems for purchasing goods. From 2021 to 2023, the studies show a 1% drop in the usage of merchant payment systems among Tanzanians.
Figure 7. Extent of use of mobile payment method in purchasing goods.
4.3. Influencing Factors to Switch Intention to the Mobile Payment Method
The researcher examined the factors that could influence the intention to switch to mobile payment methods by considering several factors.
Figure 7 shows the influence of cost or charges on the intention to switch to mobile payment methods. The study found that 89% of respondents showed the intention to switch to mobile payment methods if transaction charges or costs were low, while 2% of respondents who were interviewed did not consider transaction charges or costs an influencing factor. Thus, the study shows that a large number of small and medium entrepreneurs who deal with agricultural-based products in Morogoro Municipal, Tanzania, consider cost/charges to be an influencing factor for them to switch from cash payment systems to mobile payment methods. Therefore, the cost or charge of mobile payment methods significantly influences people who use cash payments to switch to mobile payment methods. This result is in line with an earlier study done by
| [12] | Lu, P., & Wang, S. (2020). Applying transaction cost theory and push-pull-mooring model to investigate mobile payment switching behaviors with well-established traditional financial infrastructure. Journal of Theoretical and Applied Electronic Commerce Research.
https://doi.org/10.4067/S0718-18762021000200102 |
[12]
which showed that the cost of transactions has a positive effect on the intention to switch to mobile payment methods.
Figure 8. Influence of cost/Charge on switching intention to mobile payment method.
4.3.1. The Influence of Security on Switching Intention to Mobile Payment Method
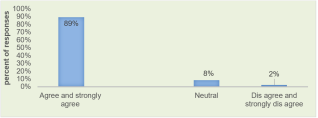
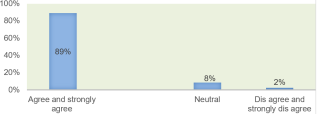
Figure 8 shows the influence of security on the intention to switch to mobile payment methods among small and medium entrepreneurs who own and do business in Morogoro Municipal, Tanzania. The study shows that 89% of respondents who were interviewed considered security to be an influencing factor for them to switch from cash payment systems to mobile payment methods. However, 8% of respondents were neutral about the security issue, while 2% of respondents disagreed that security would be an influencing factor in the intention to switch to mobile payment methods. Therefore, the security of the payment system influences the intention to switch to mobile payment methods
| [7] | Eriksson, N., Gökhan, A., & Stenius, M. (2021). A qualitative study of consumer resistance to mobile payments for in-store purchases. Procedia Computer Science, 181, 634–641.
https://doi.org/10.1016/j.procs.2021.01.212
ResearchGate SCISPACE |
[7]
. Besides, according to Tanzania Communications Regulatory Authority
| [18] | Tanzania Communications Regulatory Authority (TCRA). (2023). Quarterly Communications Statistics.
https://www.tcra.go.tz |
[18]
, Morogoro is the second region in Tanzania with a large number of fraudulent attempts at 25%, following Rukwa with 46%.
Figure 9. Influence of security on switching intention to mobile payment method.
4.3.2. The Influence of Social Efficacy on Switching Intention to Mobile Payment Method
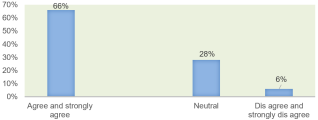
Figure 9 shows the influence of social efficacy on the intention to switch to mobile payment methods. The study shows that 66% of respondents who were interviewed agreed to switch to mobile payment methods if a large number of merchants were willing to accept payment through mobile payment methods. However, 28% of respondents were neutral, while 6% of respondents disagreed on the influence of social efficacy on the intention to switch to mobile payment methods. Therefore, social efficacy has a significant influence on Tanzanians' intention to switch to mobile payment methods if a large number of merchants are willing to accept payment through mobile payment methods when purchasing goods. The study conforms with studies done by
| [17] | Tang, K. L., Tan, M. P., & Teo, H. M. (2022). Understanding Malaysian users’ switching intention to mobile payment.
https://www.researchgate.net/publication/363862036 |
| [22] | Wani, I. B., Jan, S., & Manzoor, A. (2023). Digital Marketing Strategies and Consumer Behavior: Insights from Behavioral Economics. Journal of Emerging Technologies and Innovative Research, 10(11), 1–15. |
[17, 22]
, which show that social efficacy has a strong influence on switching to mobile payment methods.
Figure 10. The influence of social efficacy on switching intention to mobile payment method.
4.3.3. The Influence of Awareness on Switching Intention to Mobile Payment Method
The researcher examined the influence of awareness on the intention to switch to mobile payment methods.
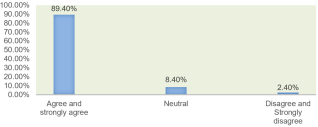
Figure 10 shows that 89.4% of respondents who were interviewed agreed that awareness is an influencing factor for them to switch from cash payment systems to mobile payment methods. This implies that despite many people owning multiple mobile money accounts, they are not aware of making payments for goods through them. A high awareness level has a significant influence on switching from cash payment systems to mobile payment methods. The result aligns with an earlier study done by
| [1] | Alarooj, N. (2019). Which factors influence consumers’ choice of payment method when purchasing online. Auckland: Auckland University of Technology. Bank of Tanzania (2022). National payment system annual report. |
[1]
which showed that understanding the payment system influences switching intention.
Figure 11. The influence of awareness on switching intention to mobile payment method.
4.3.4. Influence of Ease of Use of the System of Payment on Switching Intention to Mobile Payment Method.
The study examined the influence of the ease of use of the payment system on the intention to switch from cash payment systems to mobile payment methods.
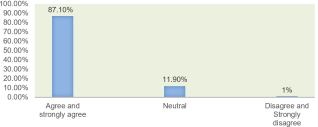
Figure 11 shows that 87.1% of respondents considered that the ease of use of the payment system would influence them to switch from cash payment systems to mobile payment methods. However, 11.9% of respondents who were interviewed were neutral, while 1% of respondents did not consider the ease of use of the payment system as an influencing factor for them to switch to mobile payment methods. This implies that complexity in the payment system is among the factors that hinder switching to another payment system. Therefore, the ease of use of the payment system has a significant influence on the intention to switch to mobile payment methods. The study findings conform with the study done by
| [1] | Alarooj, N. (2019). Which factors influence consumers’ choice of payment method when purchasing online. Auckland: Auckland University of Technology. Bank of Tanzania (2022). National payment system annual report. |
[1]
on "factors influencing consumers’ choice of payment method when purchasing online, " Showing that ease of use of the system of payment has influence on switching intention.
Figure 12. The influence of ease of use of the system on switching intention to mobile payment method.
4.3.5. The Influence of Law Enforcement on Switching Intention
The study examined the influence of law enforcement on the intention to switch to mobile payment methods.
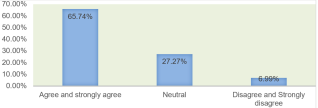
Figure 12 shows the influence of law enforcement on people’s intention to switch to mobile payment methods. The study shows that 65.74% of respondents who were interviewed responded that law enforcement would influence them to switch to mobile payment methods. However, 27.27% of respondents were neutral on the influence of law enforcement, while 6.99% of respondents disagreed that law enforcement would be an influencing factor for them to switch from cash payment systems to mobile payment methods. The study implies that law enforcement can be one of the factors that influence switching from cash payment systems to mobile payment methods.
Figure 13. The influence of law enforcement on respondents’ switching intention to mobile payment methods.
4.3.6. Relative Advantage of Mobile Payment Method on Switching Intention
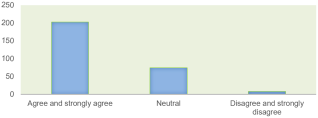
The study examined the influence of the relative advantage of mobile payment methods on the intention to switch from cash payment systems to mobile payment methods. The study wanted to know if mobile payment methods have paved the way for SMEs to create multiple value activities and become a source of poverty reduction for entrepreneurs. The study found that, out of 286 respondents who were interviewed, 203 (71%) responded that mobile payment methods have paved the way for them to create multiple value activities. However, 75 (26%) of respondents were neutral, while 8 (3%) of respondents disagreed that mobile payment methods have paved the way for them to create multiple value activities. Thus, a large number of small and medium entrepreneurs who own SMEs in Morogoro Municipal, Tanzania, showed that mobile payment methods have a relative advantage in their businesses, hence potentially influencing the switch from cash payment systems to mobile payment methods. The results are in line with the study done by
| [12] | Lu, P., & Wang, S. (2020). Applying transaction cost theory and push-pull-mooring model to investigate mobile payment switching behaviors with well-established traditional financial infrastructure. Journal of Theoretical and Applied Electronic Commerce Research.
https://doi.org/10.4067/S0718-18762021000200102 |
| [24] | Zavrumova, B. (2021). Marketing Communications and Technology in the Digital Economy. St. Pölten University. |
[12, 24],
showing that the perceived benefit of the payment system influences switching intention.
Figure 14. The influence of the relative advantage of the mobile payment method on respondents’ switching intention.
4.3.7. Association Between Switching Intention and the Factors Influencing this Intention.
The ordinal logistic regression analysis examined the influence of seven predictors (security, cost of transactions, social efficacy, awareness, ease of use, law enforcement, and relative advantage) on switching intention. Among the variables tested, cost of transactions emerged as the only statistically significant factor (p=0.038), with a strong negative coefficient (B = -3.071). This indicates that higher transaction costs substantially reduce the odds of small and medium entrepreneurs reporting higher levels of switching intention. Law enforcement showed a marginal effect (p = 0.070), indicating that stricter enforcement may also lower switching intention, though this result did not reach conventional significance. Other predictors, including security, social efficacy, awareness, ease of use, and relative advantage, these predictors did not show significant associations with switching intention, as their p-values exceeded 0.05. (
Table 5).
Table 5. Ordinal Logistic Regression Results for Switching Intention.
Variable | B | S.E. | Wald | df | Sig. | Exp (B) |
Security | -.130 | 1.042 | .016 | 1 | .900 | .878 |
Cost of transactions. | -3.071 | 1.479 | 4.313 | 1 | .038 | .046 |
Social Efficacy | .021 | 1.123 | .000 | 1 | .985 | 1.021 |
Awareness | -.964 | 2.043 | .223 | 1 | .637 | .381 |
Ease of use | -1.008 | 1.014 | .989 | 1 | .320 | .365 |
Law enforcement | -2.172 | 1.197 | 3.290 | 1 | .070 | .114 |
Relative advantage | 0.311 | 0.974 | 0.102 | 1 | .750 | 1.364 |
Constant | 13.280 | 5.862 | 5.133 | 1 | .023 | 585632.784 |
Overall, these findings suggest that security, awareness, and ease of use are necessary enabling conditions but not sufficient drivers of switching intention among SMEs in Morogoro Municipal. The results indicate that once entrepreneurs have become familiar with and confident in mobile payment systems, behavioral decisions are influenced more by tangible economic considerations than by technological characteristics. In this study, transaction costs emerged as the most influential determinant, highlighting that SMEs prioritize financial benefits and cost efficiency when deciding whether to switch from traditional payment methods to mobile payment systems.
7. Study Limitations
First, the study was limited to small and medium-sized enterprises (SMEs) engaged in agricultural-related businesses within Morogoro Municipal. As a result, the findings may not be generalizable to SMEs operating in other sectors or geographical regions of Tanzania, where business environments, technological infrastructure, and mobile payment adoption patterns may differ.
Second, although the ordinal logistic regression model incorporated key explanatory variables, it did not include other factors that may influence SMEs' switching intentions. Variables such as merchant acceptance infrastructure, network reliability, smartphone ownership, digital literacy, trust in mobile payment service providers, perceived service quality, and government policies or incentives were beyond the scope of this study. The omission of these variables may have limited the model's ability to fully explain switching intentions.
Third, the study employed a cross-sectional research design, which captured respondents' perceptions at a single point in time. Consequently, the study was unable to examine changes in switching intentions or establish causal relationships between the independent variables and switching intention over time.
Finally, the study assessed switching intention rather than actual switching behavior. Although behavioral intention is widely recognized as a strong predictor of technology adoption, intentions do not always translate into actual behavior because of contextual, financial, organizational, or environmental constraints that may arise after intentions are formed.
Future research should employ longitudinal research designs to examine changes in switching behavior over time, include more diverse samples from different sectors and regions of Tanzania, and incorporate additional explanatory variables to provide a more comprehensive understanding of the factors influencing mobile payment adoption among SMEs.





 Share This Article
 Twitter
 Linked In
 Facebook
 Copy
Copy Download