Purpose: We aim to analyze the global and regional trends of the total disease burden and risk factors of diabetes. Methods: This study was based on the Global Burden of Disease (GBD) Study 2021. The global and regional trends of incidence, deaths, prevalence, and disability-adjusted life years (DALYs) were assessed. Level 2 risk factors in the database were included. Results: In 2021, global diabetes incidence, deaths, prevalence, and DALYs were 24,442.18 thousand, 1,656.63 thousand, 525,654.11 thousand, and 78,938.59 thousand, respectively. From 1990 to 2021, global age-standardized rates increased significantly, with average annual percent changes (AAPCs) of +1.71% (incidence), +0.14% (deaths), +2.05% (prevalence), and +0.94% (DALYs). Middle and low-middle social-demographic index (SDI) regions accounted for over half of the global burden across all metrics. Low-middle SDI regions had the fastest growth in death (AAPC: +1.05%) and DALYs rates (AAPC: +1,32%), while high SDI and high-middle regions showed a mortality decline (AAPC: -1.48% and -0.24%). In recent years, global age-adjusted incidence, prevalence, and DALYs rates of diabetes maintained positive APCs, with low-middle SDI regions leading in growth, while high SDI regions saw declining mortality and accelerated incidence, and middle SDI regions sustained steady growth across key metrics. High fasting plasma glucose, high body mass index, and dietary risks were still the top three risk factors. Conclusion: The global diabetes burden has continued to rise over the past three decades. Low-middle SDI regions have the fastest growth in death and DALYs rates, while low SDI regions maintain persistently high mortality and DALYs. In recent years, low-middle and middle SDI regions still face sustained growth of age-adjusted deaths, highlighting the need for targeted interventions.
| Published in | World Journal of Public Health (Volume 11, Issue 2) |
| DOI | 10.11648/j.wjph.20261102.20 |
| Page(s) | 183-196 |
| Creative Commons |
This is an Open Access article, distributed under the terms of the Creative Commons Attribution 4.0 International License (http://creativecommons.org/licenses/by/4.0/), which permits unrestricted use, distribution and reproduction in any medium or format, provided the original work is properly cited. |
| Copyright |
Copyright © The Author(s), 2026. Published by Science Publishing Group |
Diabetes, Disease Burden, Risk Factors, SDI Regions, GBD 2021
Variables | 1990 | 2000 | 2010 | 2020 | 2021 |
|---|---|---|---|---|---|
Incidence | |||||
Global | 7780.27 [7193.59, 8397.76] (100) | 11481.12 [10697.30, 12328.88] (100) | 16633.86 [15580.17, 17832.33] (100) | 23615.01 [21925.99, 25385.07] (100) | 24442.18 [22643.51, 26301.70] (100) |
High SDI | 1699.96 [1574.18, 1830.15] (21.85) | 2452.72 [2293.14, 2609.12] (21.36) | 3493.26 [3287.31, 3703.47] (21.00) | 4872.66 [4553.11, 5211.88] (20.63) | 5048.07 [4717.30, 5376.85] (20.65) |
High-middle SDI | 1709.13 [1568.46, 1861.88] (21.97) | 2483.63 [2291.03, 2681.23] (21.63) | 3302.59 [3072.86, 3570.13] (19.85) | 4143.67 [3795.42, 4506.17] (17.55) | 4210.64 [3852.19, 4588.61] (17.23) |
Middle SDI | 2542.98 [2335.95, 2767.68] (32,68) | 3745.17 [3462.98, 4051.11] (32.62) | 5435.80 [5064.67, 5869.26] (32.68) | 7656.08 [7041.07, 8301.39] (34.42) | 7906.20 [7259.52, 8592.13] (32.35) |
Low-middle SDI | 1338.04 [1236.04, 1446.09] (17.20) | 2065.58 [1918.48, 2229.07] (18.00) | 3265.82 [3035.66, 3515.43] (19.63) | 5106.94 [4744.26, 5502.58] (21.63) | 5341.31 [4937,19, 5762.43] (21.85) |
Low SDI | 480.50 [444.84, 520.36] (6.18) | 720.89 [670.37, 777.10] (6.28) | 1118.16 [1044.83, 1200.86] (6.72) | 1811.47 [1680.98, 1952.43] (7.67) | 1911.02 [1773.05, 2070.41] (7.82) |
Deaths | |||||
Global | 672.02 [635.44, 705.31] (100) | 897.30 [852.93, 930.51] (100) | 1173.81 [1113.02, 1216.08] (100) | 1625.60 [1513.45, 1722.40] (100) | 1656.63 [1537.70, 1759.55] (100) |
High SDI | 148.64 [138.38, 153.98] (22.12) | 183.19 [168.48, 190.85] (20.42) | 187.82 [168.25, 197.67] (16.00) | 204.80 [182.75, 216.49] (12.60) | 208.89 [185.86, 221.17] (12.61) |
High-middle SDI | 116.41 [109.33, 121.84] (17.32) | 148.03 [139.58, 155.31] (16.50) | 175.52 [162.96, 183.74] (14.95) | 236.99 [215.07, 253.03] (14.58) | 240.41 [217.59, 259.73] (14.51) |
Middle SDI | 191.25 [178.57, 201.95] (28.46) | 272.98 [261.02, 283.93] (30.42) | 392.27 [374.52, 406.04] (33.42) | 575.55 [537.25, 608.77] (35.41) | 590.77 [547.72, 628.55] (35.66) |
Low-middle SDI | 141.74 [129.97, 153.16] (21.09) | 200.02 [186.10, 210.89] (22.29) | 300.86 [284.08, 315.95] (25.63) | 445.76 [412.55, 483.26] (27.42) | 451.88 [413.45, 490.41] (27.28) |
Low SDI | 72.88 [65.85, 81.43] (10.84) | 91.80 [84.03, 101.03] (10.23) | 115.75 [106.37, 126.20] (9.86) | 160.51 [143.50, 180.25] (9.87) | 162.68 [146.06, 181.92] (9.82) |
Prevalence | |||||
Global | 139107.88 [128055.50, 150839.98] (100) | 216767.91 [201463.50, 234138.19] (100) | 326141.62 [305983.08, 349505.52] (100) | 503786.75 [470111.72, 540475.25] (100) | 525654.11 [490915.91, 565380.79] (100) |
High SDI | 33473.76 [31106.89, 36120.68] (24.06) | 49948.11 [47045.93, 53057.96] (23.04) | 75053.27 [71275.48, 79506.79] (23.01) | 115796.87 [109276.75, 123010.68] (22.99) | 121029.22 [114175.11, 128605.62] (23.02) |
High-middle SDI | 32227.53 [29615.50, 35006.50] (23.17) | 50500.12 [46906.65, 54454.32] (23.30) | 70396.43 [65907.93, 75562.51] (21.58) | 100626.92 [93550.38, 108447.72] (19.97) | 103936.65 [96642.84, 112109.21] (19.77) |
Middle SDI | 43667.19 [39910.82, 47682.82] (31.39) | 69187.32 [63991.68, 75282.78] (31.92) | 103684.39 [96552.39, 111646.42] (31.79) | 159925.89 [148157.96, 172890.23] (31.74) | 166520.96 [154703.16, 180874.32] (31.68) |
Low-middle SDI | 22120.87 [20255.08, 24074.99] (15.90) | 35263.23 [32477.45, 38160.99] (16.27) | 57972.52 [53617.69, 62456.47] (17.78) | 95876.81 [88852.48, 103382.86] (19.03) | 100809.77 [93152.09, 108662.72] (19.18) |
Low SDI | 7452.51 [6848.39, 8099.47] (5.36) | 11633.16 [10722.75, 12584.55] (5.37) | 18695.00 [17319.78, 20123.85] (5.73) | 31080.41 [28744.83, 33513.17] (6.17) | 32859.09 [30377.07, 35429.67] (6.25) |
DALYs | |||||
Global | 27504.00 [24299.17, 31667.09] (100) | 38459.86 [33635.72, 44971.51] (100) | 52741.09 [45297.41, 62140.61] (100) | 76517.02 [64861.42, 92223.99] (100) | 78938.59 [66772.20, 94495.83] (100) |
Variables | AAPC | 95% CI |
|---|---|---|
Incidence | ||
Global | 1.71% | 1.69-1.73% |
High SDI | 2.31% | 2.24-2.37% |
High-middle SDI | 1.50% | 1.44-1.56% |
Middle SDI | 1.35% | 1.31-1.39% |
Low-middle SDI | 2.02% | 1.99-2.06% |
Low SDI | 1.42% | 1.40-1.45% |
Deaths | ||
Global | 0.14% | 0.08-0.21% |
High SDI | -1.48% | -1.71--1.24% |
High-middle SDI | -0.24% | -0.35--0.13% |
Middle SDI | 0.30% | 0.24-0.36% |
Low-middle SDI | 1.05% | 0.99-1.11% |
Low SDI | 0.06% | -0.03-0.15% |
Prevalence | ||
Global | 2.05% | 2.01-2.08% |
High SDI | 2.56% | 2.51-2.62% |
High-middle SDI | 1.95% | 1.87-2.04% |
Middle SDI | 1.61% | 1.60-1.65% |
Low-middle SDI | 2.35% | 2.31-2.38% |
Low SDI | 1.94% | 1.93-1.96% |
DALYs | ||
Global | 0.94% | 0.90-0.99% |
High SDI | 0.87% | 0.77-0.97% |
High-middle SDI | 0.76% | 0.68-0.84% |
Middle SDI | 0.77% | 0.73-0.81% |
Low-middle SDI | 1.32% | 1.27-1.36% |
Low SDI | 0.35% | 0.29-0.42% |
Variables | Lower endpoint | Upper endpoint | APC | 95% CI | P value |
|---|---|---|---|---|---|
Global | 1990 | 1993 | 2.28% | 2.20-2.37% | <0.001 |
1993 | 1996 | 1.61% | 1.54-1.68% | <0.001 | |
1996 | 1999 | 2.09% | 2.02-2.15% | <0.001 | |
1999 | 2006 | 1.50% | 1.46-1.53% | <0.001 | |
2006 | 2011 | 1.72% | 1.62-1.78% | <0.001 | |
2011 | 2014 | 1.94% | 1.83-1.99% | <0.001 | |
2014 | 2021 | 1.61% | 1.57-1.63% | <0.001 | |
High SDI | 1990 | 1996 | 1.79% | 1.73-1.85% | <0.001 |
1996 | 1999 | 3.34% | 3.17-3.44% | <0.001 | |
1999 | 2004 | 2.65% | 2.55-2.71% | <0.001 | |
2004 | 2011 | 1.76% | 1.69-1.81% | <0.001 | |
2011 | 2016 | 2.42% | 2.06-2.49% | <0.001 | |
2016 | 2021 | 2.68% | 2.59-2.87% | <0.001 | |
High-middle SDI | 1990 | 1993 | 2.83% | 2.71-2.96% | <0.001 |
1993 | 1996 | 1.77% | 1.65-1.88% | <0.001 | |
1996 | 1999 | 2.30% | 2.20-2.41% | <0.001 | |
1999 | 2006 | 1.15% | 1.05-1.20% | <0.001 | |
2006 | 2010 | 1.29% | 1.21-1.90% | <0.001 | |
2010 | 2015 | 1.83% | 0.92-1.93% | <0.001 | |
2015 | 2021 | 0.95% | 0.88-1.05% | <0.001 | |
Middle SDI | 1990 | 1993 | 2.59% | 2.49-2.70% | <0.001 |
1993 | 1998 | 1.18% | 1.12-1.26% | <0.001 | |
1998 | 2005 | 0.95% | 0.90-0.99% | <0.001 | |
2005 | 2014 | 1.61% | 1.58-1.64% | <0.001 | |
2014 | 2019 | 1.31% | 1.17-1.38% | <0.001 | |
2019 | 2021 | 1.71% | 1.48-1.85% | <0.001 | |
Low-middle SDI | 1990 | 1996 | 1.65% | 1.58-1.69% | <0.001 |
1996 | 1999 | 2.33% | 1.75-2.41% | <0.001 | |
1999 | 2003 | 1.63% | 1.53-2.23% | <0.001 | |
2003 | 2006 | 1.82% | 1.71-2.68% | <0.001 | |
2006 | 2009 | 2.65% | 2.20-2.73% | <0.001 | |
2009 | 2014 | 2.19% | 1.91-2.24% | <0.001 | |
2014 | 2021 | 1.90% | 1.86-1.95% | <0.001 | |
Low SDI | 1990 | 1993 | 1.54% | 1.43-1.70% | <0.001 |
1993 | 1999 | 1.37% | 1.13-1.41% | <0.001 | |
1999 | 2005 | 1.14% | 1.08-1.55% | <0.001 | |
2005 | 2016 | 1.59% | 1.57-1.64% | <0.001 | |
2016 | 2019 | 1.41% | 1.34-1.51% | <0.001 | |
2019 | 2021 | 1.93% | 1.76-2.06% | <0.001 |
Variables | Lower endpoint | Upper endpoint | APC | 95% CI | P value |
|---|---|---|---|---|---|
Global | 1990 | 1995 | 1.08% | 0.92-1.25% | <0.001 |
1995 | 2000 | -0.01% | -0.31-0.13% | 0.738 | |
2000 | 2003 | 1.10% | 0.74-1.25% | <0.001 | |
2003 | 2012 | -0.48% | -0.55--0.43% | <0.001 | |
2012 | 2019 | 0.68% | 0.61-0.85% | 0.002 | |
2019 | 2021 | -0.53% | -1.06-0.00% | 0.051 | |
High SDI | 1990 | 1994 | 0.75% | 0.30-1.20% | 0.003 |
1994 | 1998 | -0.93% | -1.65--0.21% | 0.016 | |
1998 | 2002 | 0.68% | -0.07-1.44% | 0.070 | |
2002 | 2005 | -1.46% | -3.02-0.13% | 0.069 | |
2005 | 2014 | -3.65% | -3.83--3.46% | <0.001 | |
2014 | 2017 | 0.88% | -0.89-2.68% | 0.303 | |
2017 | 2021 | -0.65% | -1.23--0.07% | 0.031 | |
High-middle SDI | 1990 | 1995 | 0.69% | 0.44-1.03% | 0.004 |
1995 | 2001 | -0.21% | -0.66--0.03% | 0.035 | |
2001 | 2004 | 1.02% | 0.47-1.32% | 0.025 | |
2004 | 2007 | -1.94% | -2.23--1.45% | 0.027 | |
2007 | 2013 | -1.15% | -1.32--0.71% | 0.022 | |
2013 | 2016 | 2.37% | 1.67-2.71% | 0.018 | |
2016 | 2021 | -0.42% | -0.82--0.14% | 0.014 | |
Middle SDI | 1990 | 1996 | 1.24% | 0.99-1.57% | 0.002 |
1996 | 2000 | -0.44% | -1.03--0.02% | 0.043 | |
2000 | 2004 | 1.39% | 1.00-1.96% | 0.017 | |
2004 | 2007 | -0.58% | -0.86-0.03% | 0.064 | |
2007 | 2021 | 0.19% | 0.11-0.37% | 0.015 | |
Low-middle SDI | 1990 | 1995 | 1.44% | 0.97-2.60% | 0.004 |
1995 | 2005 | 0.71% | -0.08-0.88% | 0.064 | |
2005 | 2008 | 2.22% | 1.16-2.67% | 0.007 | |
2008 | 2011 | 0.16% | -0.33-1.27% | 0.416 | |
2011 | 2014 | 2.08% | 1.15-2.58% | 0.021 | |
2014 | 2021 | 0.55% | 0.11-0.78% | 0.032 | |
Low SDI | 1990 | 1995 | 0.97% | 0.66-1.28% | 0.002 |
1995 | 2008 | -0.42% | -0.59--0.24% | 0.042 | |
2008 | 2011 | 0.25% | -0.43-1.42% | 0.363 | |
2011 | 2014 | 1.94% | 0.08-2.23% | 0.048 | |
2014 | 2021 | -0.23% | -0.41--0.09% | 0.025 |
Variables | Lower endpoint | Upper endpoint | APC | 95% CI | P value |
|---|---|---|---|---|---|
Global | 1990 | 1994 | 1.57% | 1.442-1.74% | <0.001 |
1994 | 2003 | 1.02% | 0.97-1.07% | <0.001 | |
2003 | 2012 | 0.57% | 0.51-0.62% | <0.001 | |
2012 | 2021 | 1.37% | 1.32-1.43% | <0.001 | |
High SDI | 1990 | 1994 | 1.24% | 1.07-1.51% | <0.001 |
1994 | 1997 | 0.86% | 0.71-1.81% | <0.001 | |
1997 | 2002 | 1.77% | 0.67-1.98% | <0.001 | |
2002 | 2005 | 0.69% | -0.42-0.98% | 0.138 | |
2005 | 2011 | -0.36% | -0.55-0.61% | 0.098 | |
2011 | 2014 | 0.64% | 0.25-2.09% | 0.038 | |
2014 | 2021 | 2.14% | 2.01-2.32% | <0.001 | |
High-middle SDI | 1990 | 1994 | 1.60% | 1.27-1.93% | <0.001 |
1994 | 2004 | 1.08% | 0.98-1.18% | <0.001 | |
2004 | 2011 | -0.19% | -0.39-0.01% | 0.060 | |
2011 | 2021 | 1.26% | 1.16-1.37% | <0.001 | |
Middle SDI | 1990 | 1995 | 1.58% | 1.39-1.74% | <0.001 |
1995 | 2001 | 0.57% | 0.26-0.78% | 0.001 | |
2001 | 2004 | 1.30% | 0.62-1.46% | <0.001 | |
2004 | 2007 | 0.03% | -0.15-1.03% | 0.513 | |
2007 | 2013 | 0.61% | 0.33-0.94% | 0.002 | |
2013 | 2021 | 1.07% | 0.96-1.35% | <0.001 | |
Low-middle SDI | 1990 | 1995 | 1.64% | 1.39-1.89% | <0.001 |
1995 | 2004 | 0.88% | 0.76-1.01% | <0.001 | |
2004 | 2014 | 1.68% | 1.57-1.80% | <0.001 | |
2014 | 2021 | 1.17% | 0.98-1.35% | <0.001 | |
Low SDI | 1990 | 1995 | 1.09% | 0.96-1.23% | <0.001 |
1995 | 1998 | 0.10% | -0.08-0.91% | 0.267 | |
1998 | 2007 | -0.12% | -0.28-0.50% | 0.062 | |
2007 | 2011 | 0.66% | 0.23-1.11% | 0.016 | |
2011 | 2014 | 1.33% | 0.56-1.46% | <0.001 | |
2014 | 2021 | 0.46% | 0.35-0.55% | 0.002 |
GBD | Global Burden of Disease |
DALYs | Disability-Adjusted Life Years |
AAPCs | Average Annual Percent Changes |
APCs | Annual Percent Changes |
SDI | Social-Demographic Index |
UI | Uncertainty Intervals |
BMI | Body Mass Index |
IHME | Institute for Health Metrics and Evaluation |
GHDx | Global Health Data Exchange |
IDF | International Diabetes Federation |
SDGs | Sustainable Development Goals |
YLDs | Years Lived with Disability |
HALE | Healthy Life Expectancy |
| [1] | Ceriello, A. and F. Prattichizzo, Variability of risk factors and diabetes complications. Cardiovasc Diabetol, 2021. 20(1): p. 101. |
| [2] | Kolarić, V., et al., CHRONIC COMPLICATIONS OF DIABETES AND QUALITY OF LIFE. Acta Clin Croat, 2022. 61(3): p. 520–527. |
| [3] | Tomic, D., J. E. Shaw, and D. J. Magliano, The burden and risks of emerging complications of diabetes mellitus. Nat Rev Endocrinol, 2022. 18(9): p. 525–539. |
| [4] | Umpierrez, G. and M. Korytkowski, Diabetic emergencies - ketoacidosis, hyperglycaemic hyperosmolar state and hypoglycaemia. Nat Rev Endocrinol, 2016. 12(4): p. 222–32. |
| [5] | Cheisson, G., et al., Perioperative management of adult diabetic patients. Preoperative period. Anaesth Crit Care Pain Med, 2018. 37 Suppl 1: p. S9–s19. |
| [6] | Berríos-Torres, S. I., et al., Centers for Disease Control and Prevention Guideline for the Prevention of Surgical Site Infection, 2017. JAMA Surg, 2017. 152(8): p. 784–791. |
| [7] | World health statistics 2024: monitoring health for the SDGs, Sustainable Development Goals. Geneva: World Health Organization; 2024. Licence: CC BY-NC-SA 3.0 IGO. |
| [8] | International Diabetes Federation. IDF Diabetes Atlas, 10th edn. Brussels, Belgium: 2021. Available at: |
| [9] | Global Burden of Disease Collaborative Network. Global Burden of Disease Study 2021 (GBD 2021) Results. Seattle, United States: Institute for Health Metrics and Evaluation (IHME), 2022. Available from |
| [10] | Sun, H., et al., IDF Diabetes Atlas: Global, regional and country-level diabetes prevalence estimates for 2021 and projections for 2045. Diabetes Res Clin Pract, 2022. 183: p. 109119. |
| [11] | Parker, E. D., et al., Economic Costs of Diabetes in the U.S. in 2022. Diabetes Care, 2024. 47(1): p. 26–43. |
| [12] | Bommer, C., et al., Global Economic Burden of Diabetes in Adults: Projections From 2015 to 2030. Diabetes Care, 2018. 41(5): p. 963–970. |
| [13] | Sun, J., et al., The Description and Prediction of Incidence, Prevalence, Mortality, Disability-Adjusted Life Years Cases, and Corresponding Age-Standardized Rates for Global Diabetes. J Epidemiol Glob Health, 2023. 13(3): p. 566–576. |
| [14] | Murray, C. J. L., The Global Burden of Disease Study at 30 years. Nat Med, 2022. 28(10): p. 2019–2026. |
| [15] | Li, Y., et al., Global, regional, and national disease burden estimates of acute lower respiratory infections due to respiratory syncytial virus in children younger than 5 years in 2019: a systematic analysis. Lancet, 2022. 399(10340): p. 2047–2064. |
| [16] | Ma, Q., et al., Temporal trend and attributable risk factors of stroke burden in China, 1990-2019: an analysis for the Global Burden of Disease Study 2019. Lancet Public Health, 2021. 6(12): p. e897–e906. |
| [17] | Global burden and strength of evidence for 88 risk factors in 204 countries and 811 subnational locations, 1990-2021: a systematic analysis for the Global Burden of Disease Study 2021. Lancet, 2024. 403(10440): p. 2162–2203. |
| [18] | Global, regional, and national comparative risk assessment of 84 behavioural, environmental and occupational, and metabolic risks or clusters of risks for 195 countries and territories, 1990-2017: a systematic analysis for the Global Burden of Disease Study 2017. Lancet, 2018. 392(10159): p. 1923–1994. |
| [19] |
GBD Protocol. Institute for Health Metrics and Evaluation. Available at
https://www.healthdata.org/research-analysis/about-gbd/protocol |
| [20] | United Nations Department of Economic and Social Affairs, Population Division (2022). World Population Prospects 2022: Summary of Results. UN DESA/POP/2022/TR/NO. 3. |
| [21] | Global, regional, and national burden of diabetes from 1990 to 2021, with projections of prevalence to 2050: a systematic analysis for the Global Burden of Disease Study 2021. Lancet, 2023. 402(10397): p. 203–234. |
| [22] | Liang, D., et al., Burden of type 1 and type 2 diabetes and high fasting plasma glucose in Europe, 1990-2019: a comprehensive analysis from the global burden of disease study 2019. Front Endocrinol (Lausanne), 2023. 14: p. 1307432. |
| [23] | Cao, X., et al., Disparities in high fasting plasma glucose-related cardiovascular disease burden in China. Nat Commun, 2024. 15(1): p. 8817. |
| [24] | Wang, M., et al., Burden of liver cancer attributable to high fasting plasma glucose: a global analysis based on the global burden of disease study 2019. J Nutr Health Aging, 2024. 28(6): p. 100261. |
| [25] | Tang, L., L. Xie, and Y. Liu, Temporal trends of ischemic stroke attributable to high fasting plasma glucose in China from the global burden of disease study 2019. Front Endocrinol (Lausanne), 2024. 15: p. 1408691. |
| [26] | Wang, C., et al., Temporal trends in mortality of tuberculosis attributable to high fasting plasma glucose in China from 1990 to 2019: a joinpoint regression and age-period-cohort analysis. Front Public Health, 2023. 11: p. 1225931. |
| [27] | Wei, H., et al., Global, regional, and national burden of chronic kidney disease attributable to high fasting plasma glucose from 1990 to 2019: a systematic analysis from the global burden of disease study 2019. Front Endocrinol (Lausanne), 2024. 15: p. 1379634. |
| [28] | Li, C., et al., Global, regional, and national burden of blindness and vision loss attributable to high fasting plasma glucose from 1990 to 2019, and forecasts to 2030: A systematic analysis for the Global Burden of Disease Study 2019. Diabetes Metab Res Rev, 2024. 40(4): p. e3802. |
| [29] | Wang, M., et al., Global Burden of Alzheimer's Disease and Other Dementias Attributed to High Fasting Plasma Glucose from 1990 to 2019. J Prev Alzheimers Dis, 2024. 11(3): p. 780–786. |
| [30] | Global incidence, prevalence, years lived with disability (YLDs), disability-adjusted life-years (DALYs), and healthy life expectancy (HALE) for 371 diseases and injuries in 204 countries and territories and 811 subnational locations, 1990-2021: a systematic analysis for the Global Burden of Disease Study 2021. Lancet, 2024. 403(10440): p. 2133–2161. |
| [31] | Malone, J. I. and B. C. Hansen, Does obesity cause type 2 diabetes mellitus (T2DM)? Or is it the opposite? Pediatr Diabetes, 2019. 20(1): p. 5–9. |
| [32] | Kuźbicka, K. and D. Rachoń, Bad eating habits as the main cause of obesity among children. Pediatr Endocrinol Diabetes Metab, 2013. 19(3): p. 106–10. |
| [33] | Li, Y., et al., Metabolic syndromes increase significantly with the accumulation of bad dietary habits. J Nutr Health Aging, 2024. 28(2): p. 100017. |
| [34] | Warburton, D. E. R. and S. S. D. Bredin, Health benefits of physical activity: a systematic review of current systematic reviews. Curr Opin Cardiol, 2017. 32(5): p. 541–556. |
APA Style
Yang, W., Jiang, W. (2026). Global and Regional Trends of the Incidence, Deaths, Prevalence, Disability-Adjusted Life Years, and Risk Factors for Diabetes, 1990-2021. World Journal of Public Health, 11(2), 183-196. https://doi.org/10.11648/j.wjph.20261102.20
ACS Style
Yang, W.; Jiang, W. Global and Regional Trends of the Incidence, Deaths, Prevalence, Disability-Adjusted Life Years, and Risk Factors for Diabetes, 1990-2021. World J. Public Health 2026, 11(2), 183-196. doi: 10.11648/j.wjph.20261102.20
@article{10.11648/j.wjph.20261102.20,
  author = {Weilin Yang and Wencai Jiang},
  title = {Global and Regional Trends of the Incidence, Deaths, Prevalence, Disability-Adjusted Life Years, and Risk Factors for Diabetes, 1990-2021},
  journal = {World Journal of Public Health},
  volume = {11},
  number = {2},
  pages = {183-196},
  doi = {10.11648/j.wjph.20261102.20},
  url = {https://doi.org/10.11648/j.wjph.20261102.20},
  eprint = {https://article.sciencepublishinggroup.com/pdf/10.11648.j.wjph.20261102.20},
  abstract = {Purpose: We aim to analyze the global and regional trends of the total disease burden and risk factors of diabetes. Methods: This study was based on the Global Burden of Disease (GBD) Study 2021. The global and regional trends of incidence, deaths, prevalence, and disability-adjusted life years (DALYs) were assessed. Level 2 risk factors in the database were included. Results: In 2021, global diabetes incidence, deaths, prevalence, and DALYs were 24,442.18 thousand, 1,656.63 thousand, 525,654.11 thousand, and 78,938.59 thousand, respectively. From 1990 to 2021, global age-standardized rates increased significantly, with average annual percent changes (AAPCs) of +1.71% (incidence), +0.14% (deaths), +2.05% (prevalence), and +0.94% (DALYs). Middle and low-middle social-demographic index (SDI) regions accounted for over half of the global burden across all metrics. Low-middle SDI regions had the fastest growth in death (AAPC: +1.05%) and DALYs rates (AAPC: +1,32%), while high SDI and high-middle regions showed a mortality decline (AAPC: -1.48% and -0.24%). In recent years, global age-adjusted incidence, prevalence, and DALYs rates of diabetes maintained positive APCs, with low-middle SDI regions leading in growth, while high SDI regions saw declining mortality and accelerated incidence, and middle SDI regions sustained steady growth across key metrics. High fasting plasma glucose, high body mass index, and dietary risks were still the top three risk factors. Conclusion: The global diabetes burden has continued to rise over the past three decades. Low-middle SDI regions have the fastest growth in death and DALYs rates, while low SDI regions maintain persistently high mortality and DALYs. In recent years, low-middle and middle SDI regions still face sustained growth of age-adjusted deaths, highlighting the need for targeted interventions.},
 year = {2026}
}
TY  - JOUR
T1  - Global and Regional Trends of the Incidence, Deaths, Prevalence, Disability-Adjusted Life Years, and Risk Factors for Diabetes, 1990-2021
AU  - Weilin Yang
AU  - Wencai Jiang
Y1  - 2026/06/02
PY  - 2026
N1  - https://doi.org/10.11648/j.wjph.20261102.20
DO  - 10.11648/j.wjph.20261102.20
T2  - World Journal of Public Health
JF  - World Journal of Public Health
JO  - World Journal of Public Health
SP  - 183
EP  - 196
PB  - Science Publishing Group
SN  - 2637-6059
UR  - https://doi.org/10.11648/j.wjph.20261102.20
AB  - Purpose: We aim to analyze the global and regional trends of the total disease burden and risk factors of diabetes. Methods: This study was based on the Global Burden of Disease (GBD) Study 2021. The global and regional trends of incidence, deaths, prevalence, and disability-adjusted life years (DALYs) were assessed. Level 2 risk factors in the database were included. Results: In 2021, global diabetes incidence, deaths, prevalence, and DALYs were 24,442.18 thousand, 1,656.63 thousand, 525,654.11 thousand, and 78,938.59 thousand, respectively. From 1990 to 2021, global age-standardized rates increased significantly, with average annual percent changes (AAPCs) of +1.71% (incidence), +0.14% (deaths), +2.05% (prevalence), and +0.94% (DALYs). Middle and low-middle social-demographic index (SDI) regions accounted for over half of the global burden across all metrics. Low-middle SDI regions had the fastest growth in death (AAPC: +1.05%) and DALYs rates (AAPC: +1,32%), while high SDI and high-middle regions showed a mortality decline (AAPC: -1.48% and -0.24%). In recent years, global age-adjusted incidence, prevalence, and DALYs rates of diabetes maintained positive APCs, with low-middle SDI regions leading in growth, while high SDI regions saw declining mortality and accelerated incidence, and middle SDI regions sustained steady growth across key metrics. High fasting plasma glucose, high body mass index, and dietary risks were still the top three risk factors. Conclusion: The global diabetes burden has continued to rise over the past three decades. Low-middle SDI regions have the fastest growth in death and DALYs rates, while low SDI regions maintain persistently high mortality and DALYs. In recent years, low-middle and middle SDI regions still face sustained growth of age-adjusted deaths, highlighting the need for targeted interventions.
VL  - 11
IS  - 2
ER  -
Department of Anesthesiology, Deyang People’s Hospital, Deyang, China
Department of Anesthesiology, Deyang People’s Hospital, Deyang, China
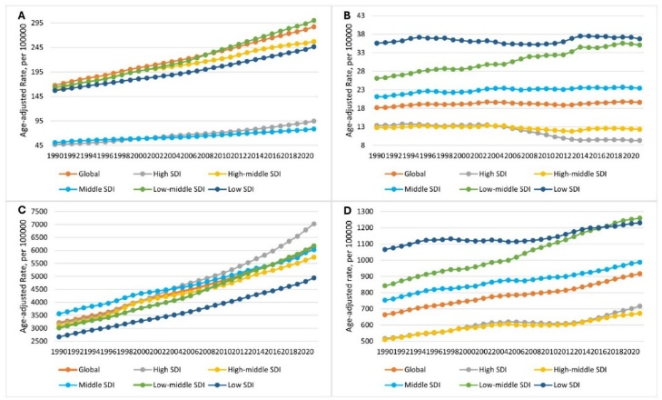
Figure 1. Global and regional dynamics of age-adjusted rates in incidence (A), deaths (B), prevalence (C), and DALYs (D).
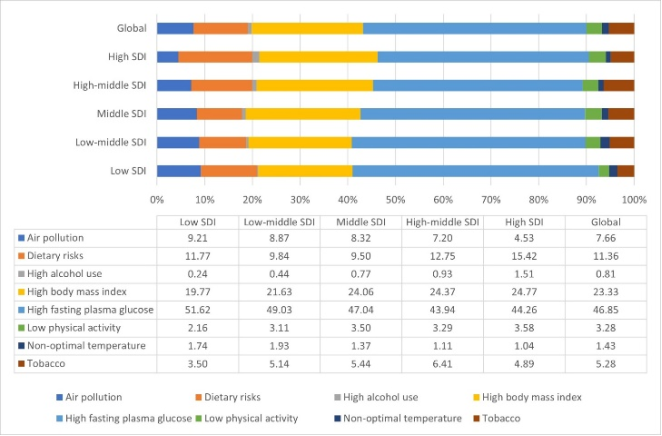
Figure 2. Proportions of diabetes attributable DALYs for different risk factors in 2021. DALYs, disability-adjusted life years. SDI, social-demographic index.
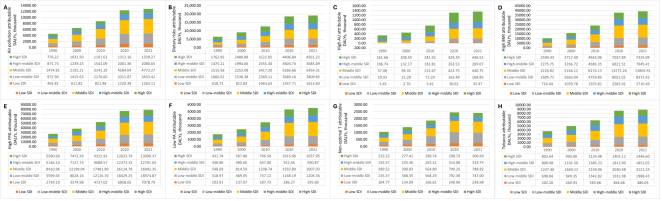
Figure 3. Trends of diabetes attributable DALYs induced by different risk factors. (A) Air pollution, (B) Dietary risks, (C) High alcohol use, (D) High BMI, (E) High fasting plasma glucose, (F) Low physical activity, (G) Non-optimal temperature, and (H) Tobacco use. DALYs, disability-adjusted life years. SDI, social-demographic index. AU, alcohol use. BMI, body mass index. FPG, fasting plasma glucose. PA, physical activity. T, temperature.
Information

