Determination of crop water requirements and appropriate irrigation scheduling is important to prevent over or under-irrigation. The study was conducted to determine the crop water requirement and irrigation scheduling of the selected cereal crops grown under irrigated conditions at Holeta, Central Highland of Ethiopia. The crops include wheat, maize, and barley. By using the 30-years climatic data, the crop evapotranspiration (ETc), reference crop evapotranspiration (ETo), and irrigation water requirement for each crop were determined by using the CROPWAT model which is based on FAO-Penman Monteith equation. The results indicated that, the CWR for the early January sown wheat, maize, and barley was 380.2mm, 433.2mm, and 399.2mm respectively. The seasonal gross irrigation requirement was estimated to be 633.67 mm, 722 mm, and 665.33 mm for wheat, maize, and barley respectively. for 1st January sown wheat, maize, and barley, irrigation should be given nine times for wheat (1-Jan, 10-Jan, 21-Jan,5-Feb, 16-Feb, 26-Feb, 11-Mar, 25-Mar, and last irrigation on 10-Apr), with GIR application of 50.3mm, 28.1mm, 34.6mm, 48.2mm,56.6mm,67.2mm,69.5mm, 66.2mm, and 72.3mm depth respectively. Seven times for maize (1-Jan, 19-Jan, 5-Feb, 19-Feb, 6-Mar, 21-Mar, and last irrigation on 10-Apr) with GIR of 54.1mm, 51.2mm, 73mm, 89.8mm,96.9mm, 97.7mm, and 100.8mm depth respectively and eight times for barley (1-Jan, 11-Jan, 25-Jan, 6-Feb, 16-Feb, 1-Mar, 15-Mar and last irrigation on 30-Mar) with GIR amount of 42.5mm, 29mm, 39.6mm, 54.1mm, 60mm, 61.6mm, 63.1mm, and 64.1mm depth at each irrigation date respectively. This study might be useful in preventing over or under-irrigation and planning water management strategies in the district for the selected crops.
| Published in | Journal of Water Resources and Ocean Science (Volume 13, Issue 3) |
| DOI | 10.11648/j.wros.20241303.12 |
| Page(s) | 73-83 |
| Creative Commons |
This is an Open Access article, distributed under the terms of the Creative Commons Attribution 4.0 International License (http://creativecommons.org/licenses/by/4.0/), which permits unrestricted use, distribution and reproduction in any medium or format, provided the original work is properly cited. |
| Copyright |
Copyright © The Author(s), 2024. Published by Science Publishing Group |
Cropwat 8.0, Crop Water Requirement, Irrigation Water Requirement, Irrigation Scheduling and Cereal Crops
Crop | Wheat | Maize | Barley | |
|---|---|---|---|---|
Date of sowing | 1 Jan | 1 Jan | 1 Jan | |
Crop coefficient (Kc) | Initial | 0.3 | 0.3 | 0.3 |
Mid | 1.15 | 1.2 | 1.10 | |
Late | 0.3 | 0.35 | 0.15 | |
Growing period (days) | Initial | 30 | 20 | 20 |
Development | 30 | 35 | 30 | |
Mid-season | 40 | 40 | 50 | |
Late season | 20 | 30 | 30 | |
Total growing days | 120 | 125 | 130 | |
Soil properties | Soil depth (cm) | Average | ||
|---|---|---|---|---|
0-30 | 30 -60 | 60- 90 | ||
Particle size distribution | ||||
Sand (%) | 47.49 | 48.46 | 12.8 | 36.25 |
Silt (%) | 11.3 | 17.95 | 34 | 21.06 |
Clay (%) | 41.19 | 33.69 | 53.2 | 42.69 |
Textural class | Sandy Clay | Sandy Clay loam | Clay | Clay |
Bulk density (g/cm3) | 1.29 | 1.30 | 1.31 | 1.3 |
Field capacity (weight basis %) | 35.64 | 37.54 | 37.38 | 36.85 |
Permanent wilting point (weight basis %) | 25.15 | 27.52 | 27.17 | 26.61 |
Total available water (mm/m) | 135.32 | 130.26 | 133.75 | 133.12 |
Month | Decade | Stage | Kc | ETc | ETc | Eff rain | Irr. Req. |
|---|---|---|---|---|---|---|---|
Coeff | mm/day | mm/dec | mm/dec | mm/dec | |||
Jan | 1 | Init | 0.3 | 1.17 | 11.7 | 0.8 | 10.8 |
Jan | 2 | Init | 0.3 | 1.18 | 11.8 | 1.2 | 10.6 |
Jan | 3 | Deve | 0.3 | 1.22 | 13.4 | 2.2 | 11.3 |
Feb | 1 | Deve | 0.49 | 2.01 | 20.1 | 3.1 | 17 |
Feb | 2 | Deve | 0.77 | 3.27 | 32.7 | 3.9 | 28.8 |
Feb | 3 | Deve | 1.03 | 4.35 | 34.8 | 5.1 | 29.7 |
Mar | 1 | Mid | 1.16 | 4.89 | 48.9 | 6.4 | 42.5 |
Mar | 2 | Mid | 1.16 | 4.88 | 48.8 | 7.6 | 41.3 |
Mar | 3 | Mid | 1.16 | 4.82 | 53 | 8.9 | 44.1 |
Apr | 1 | Mid | 1.16 | 4.75 | 47.5 | 10.6 | 36.9 |
Apr | 2 | Late | 0.93 | 3.73 | 37.3 | 12.1 | 25.2 |
Apr | 3 | Late | 0.49 | 2 | 20 | 11.5 | 8.5 |
Total | 380.2 | 73.2 | 306.9 | ||||
Month | Decade | Stage | Kc | ETc | ETc | Eff rain | Irr. Req. |
|---|---|---|---|---|---|---|---|
Coeff | mm/day | mm/dec | mm/dec | mm/dec | |||
Jan | 1 | Init | 0.3 | 1.17 | 11.7 | 0.8 | 10.8 |
Jan | 2 | Init | 0.3 | 1.18 | 11.8 | 1.2 | 10.6 |
Jan | 3 | Deve | 0.46 | 1.85 | 20.3 | 2.2 | 18.2 |
Feb | 1 | Deve | 0.73 | 3.03 | 30.3 | 3.1 | 27.2 |
Feb | 2 | Deve | 1 | 4.2 | 42 | 3.9 | 38.2 |
Feb | 3 | Mid | 1.2 | 5.06 | 40.4 | 5.1 | 35.3 |
Mar | 1 | Mid | 1.22 | 5.13 | 51.3 | 6.4 | 44.9 |
Mar | 2 | Mid | 1.22 | 5.12 | 51.2 | 7.6 | 43.6 |
Mar | 3 | Mid | 1.22 | 5.05 | 55.6 | 8.9 | 46.7 |
Apr | 1 | Late | 1.18 | 4.8 | 48 | 10.6 | 37.5 |
Apr | 2 | Late | 0.92 | 3.69 | 36.9 | 12.1 | 24.8 |
Apr | 3 | Late | 0.63 | 2.53 | 25.3 | 11.5 | 13.8 |
May | 1 | Late | 0.41 | 1.66 | 8.3 | 4.8 | 3.6 |
Total | 433.2 | 78 | 355.2 | ||||
Month | Decade | Stage | Kc | ETc | ETc | Eff rain | Irr. Req. |
|---|---|---|---|---|---|---|---|
Coeff | mm/day | mm/dec | mm/dec | mm/dec | |||
Jan | 1 | Init | 0.3 | 1.11 | 11.1 | 0.8 | 10.3 |
Jan | 2 | Init | 0.3 | 1.1 | 11 | 1.2 | 9.8 |
Jan | 3 | Deve | 0.46 | 1.72 | 18.9 | 2.2 | 16.8 |
Feb | 1 | Deve | 0.73 | 2.81 | 28.1 | 3.1 | 25.1 |
Feb | 2 | Mid | 0.99 | 3.9 | 39 | 3.9 | 35.1 |
Feb | 3 | Mid | 1.08 | 4.37 | 35 | 5.1 | 29.9 |
Mar | 1 | Mid | 1.08 | 4.48 | 44.8 | 6.4 | 38.4 |
Mar | 2 | Mid | 1.08 | 4.58 | 45.8 | 7.6 | 38.2 |
Mar | 3 | Mid | 1.08 | 4.49 | 49.4 | 8.9 | 40.5 |
Apr | 1 | Mid | 1.08 | 4.4 | 44 | 10.6 | 33.4 |
Apr | 2 | Late | 0.91 | 3.63 | 36.3 | 12.1 | 24.2 |
Apr | 3 | Late | 0.6 | 2.41 | 24.1 | 11.5 | 12.6 |
May | 1 | Late | 0.29 | 1.17 | 11.7 | 9.5 | 2.2 |
Total | 399.2 | 82.8 | 316.5 | ||||
Date | Day | Stage | Net Irr | Gr. Irr | Flow |
|---|---|---|---|---|---|
mm | Mm | l/s/ha | |||
1-Jan | 1 | Init | 30.2 | 50.3 | 5.83 |
10-Jan | 10 | Init | 16.9 | 28.1 | 0.36 |
21-Jan | 21 | Init | 20.8 | 34.6 | 0.36 |
5-Feb | 36 | Dev | 28.9 | 48.2 | 0.37 |
16-Feb | 47 | Dev | 34 | 56.6 | 0.6 |
26-Feb | 57 | Dev | 40.3 | 67.2 | 0.78 |
11-Mar | 70 | Mid | 41.7 | 69.5 | 0.62 |
25-Mar | 84 | Mid | 39.7 | 66.2 | 0.55 |
10-Apr | 100 | Mid | 43.4 | 72.3 | 0.52 |
30-Apr | End | End |
Date | Day | Stage | Net Irr | Gr. Irr | Flow |
|---|---|---|---|---|---|
Mm | Mm | l/s/ha | |||
1-Jan | 1 | Init | 32.5 | 54.1 | 6.26 |
19-Jan | 19 | Init | 30.7 | 51.2 | 0.33 |
5-Feb | 36 | Dev | 43.8 | 73 | 0.5 |
19-Feb | 50 | Dev | 53.9 | 89.8 | 0.74 |
6-Mar | 65 | Mid | 58.2 | 96.9 | 0.75 |
21-Mar | 80 | Mid | 58.6 | 97.7 | 0.75 |
10-Apr | 100 | End | 60.5 | 100.8 | 0.58 |
5-May | End |
Date | Day | Stage | Net Irr | Gr. Irr | Flow |
|---|---|---|---|---|---|
mm | Mm | l/s/ha | |||
1-Jan | 1 | Init | 25.5 | 42.5 | 4.91 |
11-Jan | 11 | Init | 17.4 | 29 | 0.34 |
25-Jan | 25 | Dev | 23.7 | 39.6 | 0.33 |
6-Feb | 37 | Dev | 32.4 | 54.1 | 0.52 |
16-Feb | 47 | Dev | 36 | 60 | 0.69 |
1-Mar | 60 | Mid | 37 | 61.6 | 0.55 |
15-Mar | 74 | Mid | 37.9 | 63.1 | 0.52 |
30-Mar | 89 | Mid | 38.5 | 64.1 | 0.49 |
10-May | End |
CWR | Crop Water Requirement |
ETo | Reference Evapotranspiration |
FAO | Food and Agriculture Organization of the United Nations |
FC | Field Capacity |
GIR | Gross Irrigation Requirement |
Hr | Hour |
Kc | Crop Coefficient |
NIR | Net Irrigation Requirement |
Peff | Effective Rainfall |
PWP | Permanent Wilting Point |
TAW | Total Available Water |
| [1] | Adeniran, K. A, Amodu, M., Amodu, M. 0., and Adeniji, F. A., 2010, “Water ii requirements of some selected crops in Kampe dam irrigation project", 1 Australian Journal of Agricultural Engineering, 1(4): 119-125. |
| [2] | Ahmadi, S. H. A., Jorenush, M. H. & Nasab, S. B. 2022. Regional modeling of winter wheat yield and water productivity under water-saving irrigation scenarios. Journal of Water and Climate Change 13(10), 3547. |
| [3] | Akinbile, C. O. 2020 Crop water requirements, biomass and grain yields estimation for upland rice using CROPWAT, AQUACROP and CERES simulation models. Agricultural Engineering International: CGR Journal, 1–20. |
| [4] | Allen, RG, Pereira LS, Raes D, Smith M (1998) Crop evapotranspiration-Guidelines for computing crop water requirements-FAO Irrigation and drainage paper 56. Fao, Rome, 300(9), p. D05109 |
| [5] | Bhat, S. A., Pandit, B. A., Khan, J. N., Kumar, R. and Jan, R. 2017. Water requirements and irrigation scheduling of maize crop using CROPWAT model. Int. J. Curr. Microbiol. App. Sci. 6(11): 1662–1670. |
| [6] | Chaali, N., Ouazaa, S., Jaramillo-Barrios, C. I., Carrillo, C. A. A. & Pedraza, E. A. A. 2020 Edaphoclimatic characterization and crop water requirement of Arracacha (Arracacia xanthorrhiza Bancroft) roots in upland production areas. Scientia Horticulture 272, 109533. |
| [7] | Ewaid, S. H., Abed, S. A. & Al-Ansari, N. 2019 Crop water requirements and irrigation schedules for some major crops in Southern Iraq. Water 11(4), 756. |
| [8] | Gabr, M. E. & Fattouh, E. M. 2021 Assessment of irrigation management practices using FAO-CROPWAT 8, case studies: tina plain and east South El-Kantara, Sinai, Egypt. Ain Shams Engineering Journal 12(2), 1623–1636. ISSN 2090-4479, |
| [9] | Gebremariam, F. T., Habtu, S., Yazew, E. & Teklu, B. 2021. The water footprint of irrigation-supplemented cotton and mungbean crops in Northern Ethiopia. Heliyon 7(4), e06822. ISSN 2405-8440, |
| [10] | Mehanuddin H, Nikhitha GR, Prapthishree KS, Praveen LB, Manasa, HG (2018) Study on water requirement of selected crops and irrigation scheduling using CROPWAT 8.0. Int. J. of Innov. Res. in Sci. Engg. and Tech, 7(4), pp.3431-3436. |
| [11] | Mehrabi, F. & Sepaskhah, A. R. 2018 Interaction effects of planting method, irrigation regimes, and nitrogen application rates on yield, water and nitrogen use efficiencies of winter wheat (Triticum aestivum). International Journal of Plant Production 12(4), 265–283. h |
| [12] | Moseki, O., Murray-Hudson, M. & Kashe, K. 2019 Crop water and irrigation requirements of Jatropha curcas L. in semi-arid conditions of Botswana: applying the CROPWAT model. Agricultural Water Management 225, 105754. ISSN 0378-3774. |
| [13] | Nivesh, S., Kashyap, P. S. and Saran, B., 2019. Irrigation water requirement modelling using CROPWAT model: Balangir district, Odisha. The Parma Innov J, 8(12), pp. 185-8. |
| [14] | Platform, S. A. I. 2010. Water conservation technical briefs. TB7–Wastewater use in agriculture. Sustainable Agriculture Initiative (SAI). Brussels, Belgium. |
| [15] | Roja, M., Deepthi C H, Devender Reddy M (2020) Estimation of Crop Water Requirement of Maize Crop Using FAO CROPWAT 8.0 Model, Ind. J. Pure App. Biosci. 8(6): 222-228. |
| [16] | Smith KA, Mullins CE (1991) Soil analysis. SMR, 873: 7. |
| [17] | Smith M (1992) CROPWAT: A computer program for irrigation planning and management (No. 46). Food & Agriculture Organizations. |
| [18] | Solangi, G. S., Shah, S. A., Alharbi, R. S., Panhwar, S., Keerio, H. A., Kim, T.-W., Memon, J. A. & Bughio, A. D. 2022 Investigation of irrigation water requirement for major crops in Pakistan using CROPWAT model based on climate data. Water 14, 2578. |
| [19] | Solgi, S., Ahmadi, S. H., Sepaskhah, A. R. & Edalat, M. 2022 Wheat yield modeling under water-saving irrigation and climatic scenarios in transition from surface to sprinkler irrigation systems. Journal of Hydrology 612(Part A), 128053. |
| [20] | Steduto, P., Hsiao, T. C., Fereres, E. and Raes, D., 2012. Crop yield response to water (Vol. 1028, p. 99). Rome, Italy: fao. |
APA Style
Abebe, N., Temam, M. (2024). Determination of Water Requirements and Irrigation Scheduling for Major Cereal Crops Grown in Welmera District, Central Highland of Ethiopia. Journal of Water Resources and Ocean Science, 13(3), 73-83. https://doi.org/10.11648/j.wros.20241303.12
ACS Style
Abebe, N.; Temam, M. Determination of Water Requirements and Irrigation Scheduling for Major Cereal Crops Grown in Welmera District, Central Highland of Ethiopia. J. Water Resour. Ocean Sci. 2024, 13(3), 73-83. doi: 10.11648/j.wros.20241303.12
AMA Style
Abebe N, Temam M. Determination of Water Requirements and Irrigation Scheduling for Major Cereal Crops Grown in Welmera District, Central Highland of Ethiopia. J Water Resour Ocean Sci. 2024;13(3):73-83. doi: 10.11648/j.wros.20241303.12
@article{10.11648/j.wros.20241303.12,
  author = {Nigusie Abebe and Mohammed Temam},
  title = {Determination of Water Requirements and Irrigation Scheduling for Major Cereal Crops Grown in Welmera District, Central Highland of Ethiopia
},
  journal = {Journal of Water Resources and Ocean Science},
  volume = {13},
  number = {3},
  pages = {73-83},
  doi = {10.11648/j.wros.20241303.12},
  url = {https://doi.org/10.11648/j.wros.20241303.12},
  eprint = {https://article.sciencepublishinggroup.com/pdf/10.11648.j.wros.20241303.12},
  abstract = {Determination of crop water requirements and appropriate irrigation scheduling is important to prevent over or under-irrigation. The study was conducted to determine the crop water requirement and irrigation scheduling of the selected cereal crops grown under irrigated conditions at Holeta, Central Highland of Ethiopia. The crops include wheat, maize, and barley. By using the 30-years climatic data, the crop evapotranspiration (ETc), reference crop evapotranspiration (ETo), and irrigation water requirement for each crop were determined by using the CROPWAT model which is based on FAO-Penman Monteith equation. The results indicated that, the CWR for the early January sown wheat, maize, and barley was 380.2mm, 433.2mm, and 399.2mm respectively. The seasonal gross irrigation requirement was estimated to be 633.67 mm, 722 mm, and 665.33 mm for wheat, maize, and barley respectively. for 1st January sown wheat, maize, and barley, irrigation should be given nine times for wheat (1-Jan, 10-Jan, 21-Jan,5-Feb, 16-Feb, 26-Feb, 11-Mar, 25-Mar, and last irrigation on 10-Apr), with GIR application of 50.3mm, 28.1mm, 34.6mm, 48.2mm,56.6mm,67.2mm,69.5mm, 66.2mm, and 72.3mm depth respectively. Seven times for maize (1-Jan, 19-Jan, 5-Feb, 19-Feb, 6-Mar, 21-Mar, and last irrigation on 10-Apr) with GIR of 54.1mm, 51.2mm, 73mm, 89.8mm,96.9mm, 97.7mm, and 100.8mm depth respectively and eight times for barley (1-Jan, 11-Jan, 25-Jan, 6-Feb, 16-Feb, 1-Mar, 15-Mar and last irrigation on 30-Mar) with GIR amount of 42.5mm, 29mm, 39.6mm, 54.1mm, 60mm, 61.6mm, 63.1mm, and 64.1mm depth at each irrigation date respectively. This study might be useful in preventing over or under-irrigation and planning water management strategies in the district for the selected crops.
},
 year = {2024}
}
TY  - JOUR
T1  - Determination of Water Requirements and Irrigation Scheduling for Major Cereal Crops Grown in Welmera District, Central Highland of Ethiopia

AU  - Nigusie Abebe
AU  - Mohammed Temam
Y1  - 2024/08/20
PY  - 2024
N1  - https://doi.org/10.11648/j.wros.20241303.12
DO  - 10.11648/j.wros.20241303.12
T2  - Journal of Water Resources and Ocean Science
JF  - Journal of Water Resources and Ocean Science
JO  - Journal of Water Resources and Ocean Science
SP  - 73
EP  - 83
PB  - Science Publishing Group
SN  - 2328-7993
UR  - https://doi.org/10.11648/j.wros.20241303.12
AB  - Determination of crop water requirements and appropriate irrigation scheduling is important to prevent over or under-irrigation. The study was conducted to determine the crop water requirement and irrigation scheduling of the selected cereal crops grown under irrigated conditions at Holeta, Central Highland of Ethiopia. The crops include wheat, maize, and barley. By using the 30-years climatic data, the crop evapotranspiration (ETc), reference crop evapotranspiration (ETo), and irrigation water requirement for each crop were determined by using the CROPWAT model which is based on FAO-Penman Monteith equation. The results indicated that, the CWR for the early January sown wheat, maize, and barley was 380.2mm, 433.2mm, and 399.2mm respectively. The seasonal gross irrigation requirement was estimated to be 633.67 mm, 722 mm, and 665.33 mm for wheat, maize, and barley respectively. for 1st January sown wheat, maize, and barley, irrigation should be given nine times for wheat (1-Jan, 10-Jan, 21-Jan,5-Feb, 16-Feb, 26-Feb, 11-Mar, 25-Mar, and last irrigation on 10-Apr), with GIR application of 50.3mm, 28.1mm, 34.6mm, 48.2mm,56.6mm,67.2mm,69.5mm, 66.2mm, and 72.3mm depth respectively. Seven times for maize (1-Jan, 19-Jan, 5-Feb, 19-Feb, 6-Mar, 21-Mar, and last irrigation on 10-Apr) with GIR of 54.1mm, 51.2mm, 73mm, 89.8mm,96.9mm, 97.7mm, and 100.8mm depth respectively and eight times for barley (1-Jan, 11-Jan, 25-Jan, 6-Feb, 16-Feb, 1-Mar, 15-Mar and last irrigation on 30-Mar) with GIR amount of 42.5mm, 29mm, 39.6mm, 54.1mm, 60mm, 61.6mm, 63.1mm, and 64.1mm depth at each irrigation date respectively. This study might be useful in preventing over or under-irrigation and planning water management strategies in the district for the selected crops.

VL  - 13
IS  - 3
ER  -
Ethiopian Institute of Agricultural Research, Holeta Agricultural Research Center, Holeta, Ethiopia
Ethiopian Institute of Agricultural Research, Holeta Agricultural Research Center, Holeta, Ethiopia
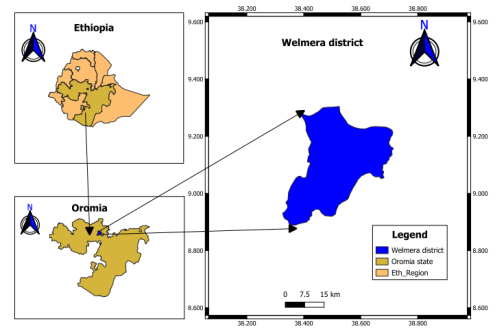
Figure 1. Geographical location of the study area.
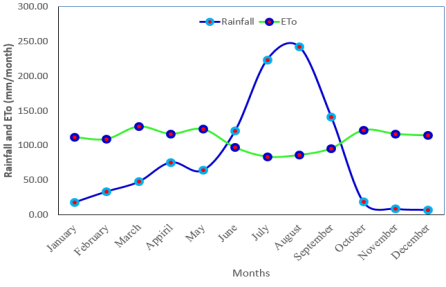
Figure 2. Relationship between rainfall and evapotranspiration of the study area.

Figure 3. Flow chart for the estimation of irrigation demand and scheduling using CROPWAT model.
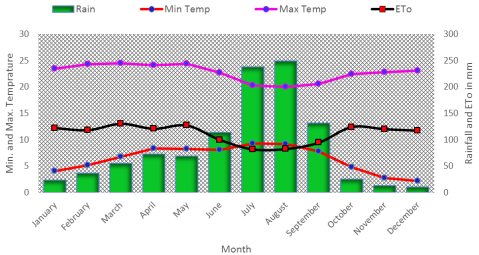
Figure 4. Mean monthly rainfall, evapotranspiration, minimum and maximum temperature of the study area
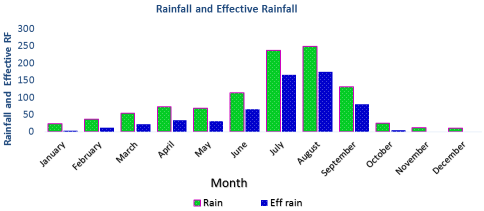
Figure 5. Rainfall and effective rainfall of the district.
Information

