
Land use/ Land cover (LULC) classification plays a vital role in understanding environmental changes and for supporting sustainable land management in Ura District (Assosa town). This study aims to analyse the spatial distribution and patterns of LULC in study area using remote sensing and GIS techniques. Multispectral satellite imagery’s (Landsat 7, Landsat 8 and Landsat 9) was classified using supervised image classification method into major classes including agricultural land, forest, built-up, grassland and bare land. Accuracy assessment was performed using Confusion matrix, resulting overall accuracy (88.00%, 92.00% and 96.00%) and a Kappa Coefficient of (0.8507, 0.8355 and 0.9232) in 2001, 2013 and 2025 respectively. The result indicates that the dominant class forest cover the large portion of the study area 48.934451%, followed by Grassland (25.297372%) and agriculture (13.247733%) in 2001. Built-up, bare land and agricultural areas have increased by 12.970652%, 22.792803% and 2.390367% respectively while forest cover and grassland has decreased by 20.805041% and 17.348774 in past 25 years (2001 – 2025). The study highlights significant land use changes and their environmental implications. These findings provide valuable information for land use planning and sustainable resource management. The integration of advanced approaches such as GIS, Remote sensing and Machin learning technologies are recommended for improving future LULC analysis.
| Published in | American Journal of Remote Sensing (Volume 14, Issue 2) |
| DOI | 10.11648/j.ajrs.20261402.12 |
| Page(s) | 34-44 |
| Creative Commons |
This is an Open Access article, distributed under the terms of the Creative Commons Attribution 4.0 International License (http://creativecommons.org/licenses/by/4.0/), which permits unrestricted use, distribution and reproduction in any medium or format, provided the original work is properly cited. |
| Copyright |
Copyright © The Author(s), 2026. Published by Science Publishing Group |
LULC, GIS and Remote Sensing, Supervised Image Classification, Accuracy Assessment, Change Detection, Ura District (Assosa Town)
Sources | Data type |
|---|---|
USGS Earth Explorer | Landsat image |
Ethio administration boundary | Shape file of the study area |
software’s | Function |
|---|---|
ArcMap | For visualizing and displaying compose maps |
ERDAS IMAGIN 2015 | For image preprocessing and analysis |
Google Earth | For visualizing the study area (to identify what was existed and what is existed on the area for each time periods). |
MS office | For writing, preparing charts, graphs and statistical analysis |
LULC class types | Methods of category |
|---|---|
Agricultural land | All land areas with agricultural crops |
Built up | Individual and clusters of building (Residential, Commercial and services, Industrial), road networks. |
Forest | Characterized by relatively dense forest vegetative |
Bare land | agricultural lands without crops and exposed areas |
Grassland | The land areas with small vegetative ground covers (grasses). |
CLASS_NAME | AREA 2001 | AREA 2013 | AREA 2025 |
|---|---|---|---|
agricultural land | 11265.21 | 20978.28 | 19509.75 |
Bare land | 127.89 | 9649.71 | 6759.09 |
Built-up | 10518.87 | 17789.07 | 21548.46 |
forest | 41611.41 | 18902.16 | 23919.84 |
grassland | 21511.62 | 17715.78 | 13297.86 |
Grand Total | 85035 | 85035 | 85035 |
Class Name | AREA in 2001 | Area in Percentage 2001 | AREA 2013 | Area in Percentage 2013 | Area in 2025 | Area in Percentage 2025 |
|---|---|---|---|---|---|---|
Agricultural land | 11265.21 | 13.247733 | 20978.28 | 24.670171 | 13297.86 | 15.6381% |
Bare land | 127.89 | 0.150397 | 9649.71 | 11.347927 | 19509.75 | 22.9432 |
Built-up | 10518.87 | 12.370048 | 17789.07 | 20.919704 | 21548.46 | 25.3407 |
Forest | 41611.41 | 48.934451 | 18902.16 | 22.228682 | 23919.84 | 28.12941 |
Grassland | 21511.62 | 25.297372 | 17715.78 | 20.833516 | 6759.09 | 7.948598 |
Grand Total | 85035 | 100 | 85035 | 100 | 85035 | 100 |
2001 | 2013 | 2025 | |
|---|---|---|---|
Overall Classification Accuracy% | 88.00% | 92.00% | 96.00% |
Overall Kappa (k) Statistics | 0.8507 | 0.8355 | 0.9232 |
Class Name | 2001% | 2013% | 2025% | |||
|---|---|---|---|---|---|---|
Producer Accuracy | User Accuracy | Producer Accuracy | User Accuracy | Producer Accuracy | User Accuracy | |
Forest | 100% | 90% | 100% | 100% | 100% | 83.33% |
Built-up | 83.33% | 100% | 91.67% | 97.06% | 100% | 97.06% |
Bare land | 100% | 70% | 50% | 50% | 100% | 100% |
Agriculture | 100% | 90% | 100% | 60% | 83.33% | 100% |
Grassland | 75% | 90% | 100% | 100% | 75% | 100% |
Land use classes | 2001 | 2013 | Area Change | |||
|---|---|---|---|---|---|---|
Area in Ha | Area in% | Area in Ha | Area in% | Area in Ha | Area in% | |
Agriculture | 11265.21 | 13.247733 | 20978.28 | 24.670171 | +9,713.07 | +11.422438 |
Bare land | 127.89 | 0.150397 | 9649.71 | 11.347927 | +9,521.82 | +11.19753 |
Built-up | 10518.87 | 12.370048 | 17789.07 | 20.919704 | +7,270.2 | +8.549656 |
Forest | 41611.41 | 48.934451 | 18902.16 | 22.228682 | -22,709.25 | -26.705769 |
Grassland | 21511.62 | 25.297372 | 17715.78 | 20.833516 | -3,795.84 | -4.463856 |
Land use classes | 2001 | 2025 | Area Change | |||
|---|---|---|---|---|---|---|
Area in Ha | Area in% | Area in Ha | Area in% | Area in Ha | Area in% | |
Agriculture | 11265.21 | 13.247733 | 13297.86 | 15.6381 | +2,032.65 | +2.390367 |
Bare land | 127.89 | 0.150397 | 19509.75 | 22.9432 | +19,381.86 | +22.792803 |
Built-up | 10518.87 | 12.370048 | 21548.46 | 25.3407 | +11,029.59 | +12.970652 |
Forest | 41611.41 | 48.934451 | 23919.84 | 28.12941 | -17,691.57 | -20.805041 |
Grassland | 21511.62 | 25.297372 | 6759.09 | 7.948598 | -14,752.53 | -17.348774 |
Land use classes | 2013 | 2025 | Area Change | |||
|---|---|---|---|---|---|---|
Area in Ha | Area in% | Area in Ha | Area in% | Area in Ha | Area in% | |
Agriculture | 20978.28 | 24.670171 | 13297.86 | 15.6381 | -7,680.42 | -9.032071 |
Bare land | 9649.71 | 11.347927 | 19509.75 | 22.9432 | +9,860.04 | +11.595273 |
Built-up | 17789.07 | 20.919704 | 21548.46 | 25.3407 | +3,759.39 | +4.420996 |
Forest | 18902.16 | 22.228682 | 23919.84 | 28.12941 | +5,017.68 | +5.900728 |
Grassland | 17715.78 | 20.833516 | 6759.09 | 7.948598 | -10,956.69 | -12.884918 |
GIS | Geographic Information System |
LULC | Land Use and Land Cover |
RS | Remote Sensing |
ERDAS | Earth Resource Data Analysis System |
| [1] | Lambin, E. F., Geist, H. J., & Lepers, E. (2003). Dynamics of land-use and land-cover change in tropical regions. Annual Review of Environment and Resources, 28(1), 205–241. |
| [2] | Rindfuss, R. R., Walsh, S. J., Turner, B. L., Fox, J., & Mishra, V. Developing a science of land change: Challenges and methodological issues. Proceedings of the National Academy of Sciences, 2004, 101(39), 13976-13981. |
| [3] | Pouyat, R. V., Pataki, D. E., Belt, K. T., Groffman, P. M., Hom, J., & Band, L. E. Effects of Urban Land-Use Change on Biogeochemical Cycles. Terrestrial Ecosystems in a Changing World, 2007. |
| [4] | Gebrelibanos, T., & Assen, M. Land use/land cover dynamics and their driving forces in the Hirmi watershed and its adjacent agro-ecosystem, highlands of Northern Ethiopia. Journal of Land Use Science, 2015, 10(1), 81-94. |
| [5] |
Lepers, E., Lambin, E. F., Janetos, A. C., DeFries, R., Achard, F., Ramankutty, N., & Scholes, R. J. A Synthesis of Information on Rapid Land-cover Change for the Period 1981–2000. BioScience, 2005, 55(2), 115-124.
https://doi.org/10.1641/0006-3568(2005)055[0115:ASOIOR]2.0.CO;2 |
| [6] | Food and Agriculture Organization. (2020). Global forest resources assessment 2020. Rome: FAO. |
| [7] | Agarwal, C. (2002) A Review and Assessment of Land-use Change Models: Dynamics of Space, Time, and Human Choice (Vol. 297). US Department of Agriculture, Forest Service, Northeastern Research Station. |
| [8] | Asenake, Y. and Amare, B. (2019) Land Use/Cover Spatiotemporal Dynamics, Driving Forces and Implications at the Beshillo Catchment of the Blue Nile Basin, North Eastern Highlands of Ethiopia. Environmental System Research, 8(21), 1-30. |
| [9] | Turner, B. L., Lambin, E. F., & Reenberg, A. (2007). The emergence of land change science for global environmental change and sustainability. |
| [10] | Tahir, Mary, Ekwal Imam, and Tahir Hussain. "Evaluation of land use/land cover changes in Mekelle City, Ethiopia using Remote Sensing and GIS." Computational Ecology and Software 3.1 (2013): 9. |
| [11] | European Space Agency. (2021). Sentinel-2 user handbook. ESA Publications. |
| [12] | Singh, A. (1989). Digital change detection techniques using remotely sensed data. International Journal of Remote Sensing, 10(6), 989–1003. |
| [13] | Mustafa, Yaseen Taha, Rebar Tahseen Ali, and Razwan Mohammed Saleh. "Monitoring and evaluating land cover change in the Duhok city, Kurdistan region-Iraq, by using remote sensing and GIS." International Journal of Engineering Inventions 1.11 (2012): 28-33. |
| [14] | Lambin, E. F., Turner, B. L., Geist, H. J., Agbola, S. B., Angelsen, A., Bruce, J. W., Coomes, O. T., Dirzo, R., Fischer, G., Folke, C., George, P. S., Homewood, K., Imbernon, J., Leemans, R., Li, X., Moran, E. F., Mortimore, M., Ramakrishnan, P. S., Richards, J. F., Skånes, H., Steffen, W., Stone, G. D., Svedin, U., Veldkamp, T. A., Vogel, C., & Xu, J. The causes of land-use and land-cover change: moving beyond the myths. Global Environmental Change, 2001, 11(4), 261-269. |
| [15] | Anderson, J. R., Hardy, E. E., Roach, J. T., & Witmer, R. E. (1976). A Land Use and Land Cover Classification System for Use with Remote Sensor Data. U.S. Geological Survey Pr-ofessional Paper 964. |
| [16] | Roy, P. S., and Arijit Roy. "Land use and land cover change in India: Aremote sensing & GIS prespective." Journal of the Indian Institute of Science 90.4 (2010): 489-502. |
APA Style
Gemechu, T. T. (2026). Spatiotemporal Analysis of Land Use and Land Cover Change over 25 Years Using Landsat Image in Case of Ura District (Assosa), Ethiopia. American Journal of Remote Sensing, 14(2), 34-44. https://doi.org/10.11648/j.ajrs.20261402.12
ACS Style
Gemechu, T. T. Spatiotemporal Analysis of Land Use and Land Cover Change over 25 Years Using Landsat Image in Case of Ura District (Assosa), Ethiopia. Am. J. Remote Sens. 2026, 14(2), 34-44. doi: 10.11648/j.ajrs.20261402.12
@article{10.11648/j.ajrs.20261402.12,
  author = {Tariku Tamiru Gemechu},
  title = {Spatiotemporal Analysis of Land Use and Land Cover Change over 25 Years Using Landsat Image in Case of Ura District (Assosa), Ethiopia},
  journal = {American Journal of Remote Sensing},
  volume = {14},
  number = {2},
  pages = {34-44},
  doi = {10.11648/j.ajrs.20261402.12},
  url = {https://doi.org/10.11648/j.ajrs.20261402.12},
  eprint = {https://article.sciencepublishinggroup.com/pdf/10.11648.j.ajrs.20261402.12},
  abstract = {Land use/ Land cover (LULC) classification plays a vital role in understanding environmental changes and for supporting sustainable land management in Ura District (Assosa town). This study aims to analyse the spatial distribution and patterns of LULC in study area using remote sensing and GIS techniques. Multispectral satellite imagery’s (Landsat 7, Landsat 8 and Landsat 9) was classified using supervised image classification method into major classes including agricultural land, forest, built-up, grassland and bare land. Accuracy assessment was performed using Confusion matrix, resulting overall accuracy (88.00%, 92.00% and 96.00%) and a Kappa Coefficient of (0.8507, 0.8355 and 0.9232) in 2001, 2013 and 2025 respectively. The result indicates that the dominant class forest cover the large portion of the study area 48.934451%, followed by Grassland (25.297372%) and agriculture (13.247733%) in 2001. Built-up, bare land and agricultural areas have increased by 12.970652%, 22.792803% and 2.390367% respectively while forest cover and grassland has decreased by 20.805041% and 17.348774 in past 25 years (2001 – 2025). The study highlights significant land use changes and their environmental implications. These findings provide valuable information for land use planning and sustainable resource management. The integration of advanced approaches such as GIS, Remote sensing and Machin learning technologies are recommended for improving future LULC analysis.},
 year = {2026}
}
TY  - JOUR
T1  - Spatiotemporal Analysis of Land Use and Land Cover Change over 25 Years Using Landsat Image in Case of Ura District (Assosa), Ethiopia
AU  - Tariku Tamiru Gemechu
Y1  - 2026/07/11
PY  - 2026
N1  - https://doi.org/10.11648/j.ajrs.20261402.12
DO  - 10.11648/j.ajrs.20261402.12
T2  - American Journal of Remote Sensing
JF  - American Journal of Remote Sensing
JO  - American Journal of Remote Sensing
SP  - 34
EP  - 44
PB  - Science Publishing Group
SN  - 2328-580X
UR  - https://doi.org/10.11648/j.ajrs.20261402.12
AB  - Land use/ Land cover (LULC) classification plays a vital role in understanding environmental changes and for supporting sustainable land management in Ura District (Assosa town). This study aims to analyse the spatial distribution and patterns of LULC in study area using remote sensing and GIS techniques. Multispectral satellite imagery’s (Landsat 7, Landsat 8 and Landsat 9) was classified using supervised image classification method into major classes including agricultural land, forest, built-up, grassland and bare land. Accuracy assessment was performed using Confusion matrix, resulting overall accuracy (88.00%, 92.00% and 96.00%) and a Kappa Coefficient of (0.8507, 0.8355 and 0.9232) in 2001, 2013 and 2025 respectively. The result indicates that the dominant class forest cover the large portion of the study area 48.934451%, followed by Grassland (25.297372%) and agriculture (13.247733%) in 2001. Built-up, bare land and agricultural areas have increased by 12.970652%, 22.792803% and 2.390367% respectively while forest cover and grassland has decreased by 20.805041% and 17.348774 in past 25 years (2001 – 2025). The study highlights significant land use changes and their environmental implications. These findings provide valuable information for land use planning and sustainable resource management. The integration of advanced approaches such as GIS, Remote sensing and Machin learning technologies are recommended for improving future LULC analysis.
VL  - 14
IS  - 2
ER  -
Departement of GIS, Assosa University, Assosa, Ethiopia
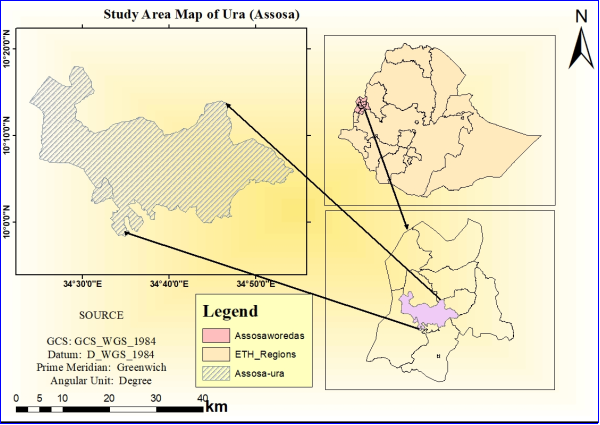
Figure 1. Study area map.
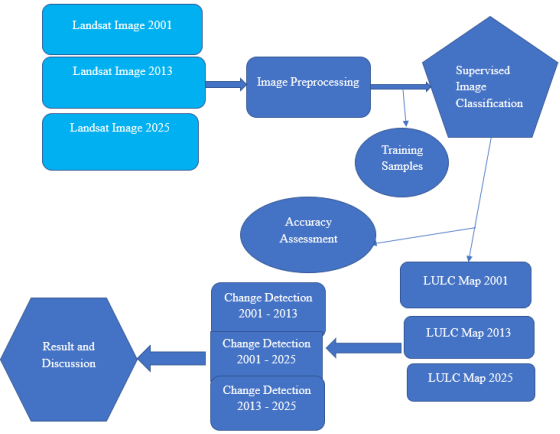
Figure 2.
The Methodology of the overall study.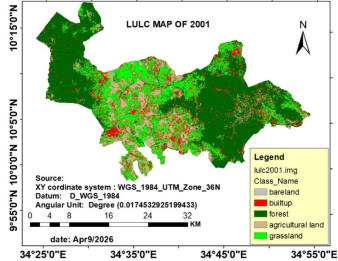
Figure 3.
LULC Classification map of Ura (Assosa) 2001.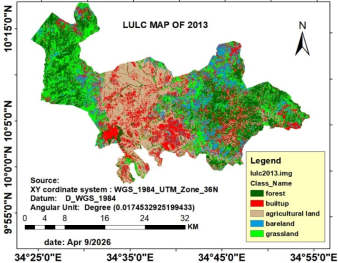
Figure 4. LULC Classification map of Ura (Assosa) 2013.
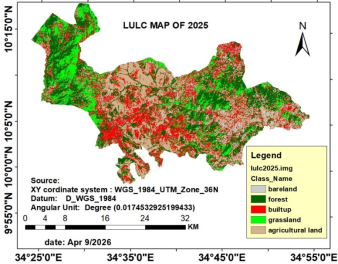
Figure 5. LULC Classification map of Ura (Assosa) 2025.
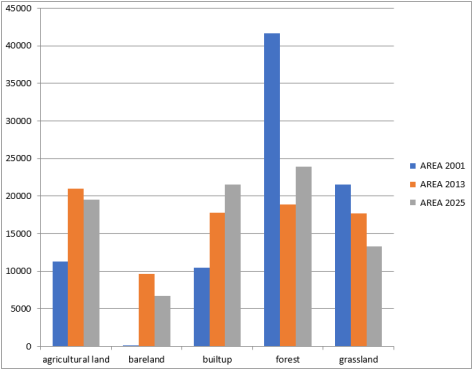
Figure 6. Bar chart of LULC quantization in Hectare for 2001, 2013 and 2025.
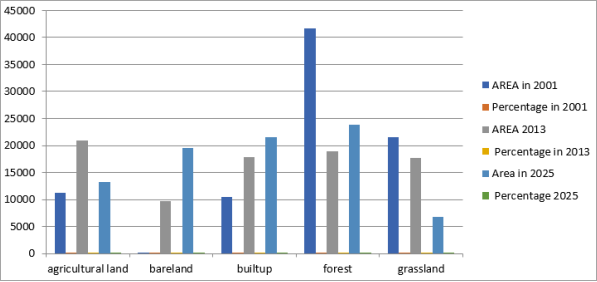
Figure 7. Bar chart of LULC quantization in Percent for 2001, 2013 and 2025.
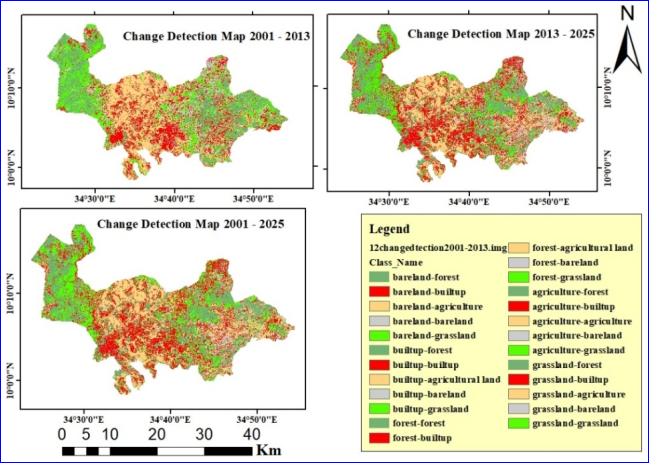
Figure 8. LULC Change Detection Map.

Information



 Share This Article
 Twitter
 Linked In
 Facebook
 Copy
Copy Download