With construction of large-capacity direct current transmission projects and large-scale integration of renewable energy, frequency security of the power system is facing severe challenges. For fast and accurate online assessment of frequency security, a data-driven frequency security assessment model based on Generative Adversarial Network (GAN) and Metric Learning (ML) is proposed in this paper. Firstly, the key frequency security indicators are selected as the outputs of the model, and the input feature set is constructed. Then, distribution information of historical operation scenarios is learned through Wasserstein Generative Adversarial Network (WGAN), in order to generate operation scenarios covering typical operation modes for training sample set establishment. The generated operation scenarios are adjusted based on rejection sampling and resampling techniques, in order to increase the density of training samples near key scenes. Finally, considering inapplicability of a single assessment model for frequency security assessment in power systems with complicated changes of operation conditions, a combined assessment model for frequency security assessment composed of multiple sub-models is constructed based on Metric Learning for Kernel Regression (MLKR). The original distance metric is adjusted with metric learning techniques to make samples with similar frequency dynamics close. Then the samples with similar frequency dynamics are clustered into the same cluster, and the corresponding sub-model is established. A simplified Shandong power system example is used to verify the effectiveness of the proposed method.
| Published in | Frontiers (Volume 5, Issue 1) |
| DOI | 10.11648/j.frontiers.20250501.12 |
| Page(s) | 30-41 |
| Creative Commons |
This is an Open Access article, distributed under the terms of the Creative Commons Attribution 4.0 International License (http://creativecommons.org/licenses/by/4.0/), which permits unrestricted use, distribution and reproduction in any medium or format, provided the original work is properly cited. |
| Copyright |
Copyright © The Author(s), 2025. Published by Science Publishing Group |
Frequency Security, Machine Learning, Data-Driven, Generative Adversarial Network, Metric Learning
 , the maximum frequency rate of change
  and the quasi-steady-state frequency deviation
  are important indicators reflecting frequency security of power systems after power disturbance
  is related to the inertia response process of units after the occurrence of power disturbance events, which determines action of relevant system protections;
  is related to the amount of power disturbance caused by power disturbance events and inertia of the system;
  can be used to judge whether the steady frequency satisfies the corresponding requirements. In this paper, the data-driven frequency security assessment model is constructed with
  ,
,  and
and  as frequency security indicators.
 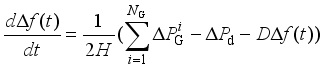 (1)
(1)  represents the frequency deviatio, H represents the inertia time constant,
  represents the active power adjustment associated with the dynamic response of the prime mover-governor system,
  rrepresents the power disturbance, D represents damping of the system, and
  represents the number of units.
  ,
,  and
and  , they are closely related to the amount of disturbance and the system inertia level, and the larger the amount of disturbance and the lower the system inertia level are, the faster the change is; for
  , the magnitude of its value is closely related to inertia level of the system, the reserve capacity, and regulation rate of units; and
  is mainly affected by factors such as the size of the power disturbance caused by the corresponding event, and the level of the reserve capacity of the power system itself. The input characteristics should be as inclusive as possible of the operating characteristics of the power system. Based on the above analysis, this paper selects the conventional unit output, reserve capacity, unit capacity, regulated power pwer unit, inertia time constant, output of the renewable energy units, system damping coefficient, load size, DC power, and disturbance amount as the original input features before the disturbance.
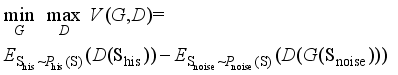
  represents the realistic distribution of historical operating scenarios for the power system. Given a noise distribution
  , the goal of GAN is to map the sampled data obtained via
  through the game process of generator and discriminator to make it as close as possible to
  .
.  , the input is the sampled noise data
  obtained via
  and the output is the generated data samples
  that simulate the distribution pattern of the real historical operating scenarios of the power system. The objective of the generator is to make the distribution of
  , which is represented by
  , as close as possible to the distribution of the real historical operating scenarios of the power system
  , and its loss function
  can be expressed as follows:
  (2)
(2)  (3)
(3)  (4)
(4) 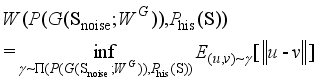 (5)
(5)  represents the set of joint probability distributions γ with
  and
and  as marginal distributions, and inf represents the maximum lower bound.
 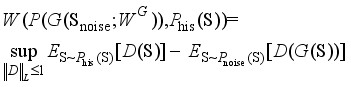 (6)
(6)  indicates that the discriminator network needs to satisfy the 1-Lipschitz conditional restriction, i.e., constraining the variation of the network parameters within a certain range during the training time, in order to ensure the normal gradient optimisation.
  ,
,  , and
, and  , the evaluation errors of the frequency safety indexes are
  ,
,  and
and  ,
,  ≤
≤  ≤
≤  . According to the principle that the newly generated scenarios
  should be as close as possible to the key samples with large evaluation errors, there should be:
  (7)
(7)  ,1≤l≤
,1≤l≤  } and the sequence {d(
  ,
,  ),1≤m≤
  } should have a high negative correlation to ensure that Eq. (7) holds, so as to generate training samples as close as possible to the key scenarios. In this paper, Spearman correlation coefficient is introduced to measure the correlation of two sequences, as shown in equation (8):
 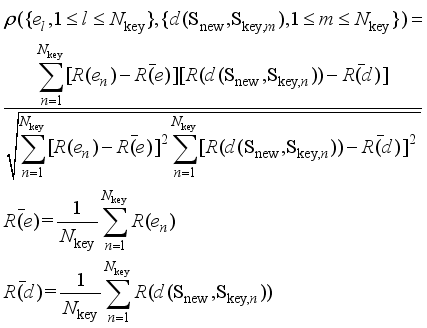 (8)
(8)  and
and 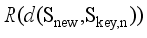 represent the rank of the sequence
  and the corresponding element in the sequence
  , respectively.
  , the rejection sampling function shown in equation (9) is constructed to screen out the training samples away from the critical scene.
 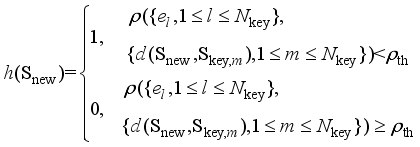 (9)
(9)  to simulate the distribution pattern of historical actual operating scenarios of the power system. New scenes are randomly divided to generate training samples and test samples, respectively. The scenarios corresponding to the test samples with test errors larger than a set threshold are defined as critical scenarios. Based on the WGAN network generator and the rejection sampling function in Eq. (9), the density of training samples near the key scenes can be increased by rejection sampling and resampling.
  ,
,  or
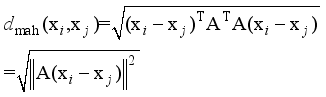
or  . x is the input feature of the model formed after the feature dimensionality reduction of the original current features. The power system inertia level, spinning reserve level, blocking DC, etc. may differ greatly under different operating scenarios, resulting in significant differences in the system frequency dynamic process after perturbation under different scenarios. In this case, the functional expression y=F(x) describing the relationship between the frequency safety index and the input features under different scenarios may have significant differences, which makes it difficult to learn y=F(x) using a single machine learning model. In this paper, a combined frequency safety assessment model consisting of several sub-models is proposed for assessing the frequency safety of the system after severe disturbances such as DC blocking.
  (10)
(10)  is shown in Equation (11):
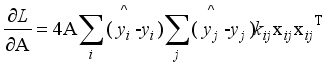
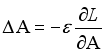
  (11)
(11)  is the true value of the frequency safety index for the jth historical training sample and m is the number of training samples.
  (12)
(12)  (13)
(13)  (14)
(14)  (15)
(15)  (16)
(16)  ,q) of the sample
  to the qth sample cluster is calculated as shown in equation (17):
  (17)
(17) 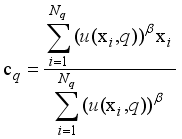 (18)
(18)  is the number of samples in the qth sample cluster.
 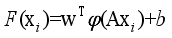 (19)
(19)  is the coefficient vector, b is the bias, and φ is the mapping of functions corresponding to the kernel function, which is taken to be the Gaussian kernel function for the SVR model in this paper.
  as the output of the model assessment indicators is demonstrated. The learning process of the model with
  and
and  as the assessment indicators is similar. In Section 4.6, the final assessment accuracy of the frequency security assessment model built based on the proposed method for each frequency security indicator is given uniformly.
  is 0.187 Hz, and the maximum testing error is 0.169 Hz. after MLKR learning, the maximum training error is reduced to 0.0404 Hz, and the maximum testing error is reduced to 0.0468 Hz. With the process of MLKR learning, the changes of training error and testing error are shown in Figure 4, where
  denotes the maximum evaluation error of all samples in each iteration. The evaluation error gradually converges as the number of MLKR learning iterations increases.
 frequency security indicator |
|
|
|
|---|---|---|---|
maximum of assessment errors | 0.0113Hz | 0.0098Hz•s-1 | 0.0092Hz |
average of assessment errors | 0.0093Hz | 0.0067Hz•s-1 | 0.0071Hz |
GAN: | Generative Adversarial Network |
ML: | Metric Learning |
WGAN: | Wasserstein Generative Adversarial Network |
MLKR | Metric Learning for Kernel Regression |
HVDC | High Voltage Direct Current |
ASF | Average System Frequency |
SFR | System Frequency Response |
SVR | Support Vector Regression |
ELM | Extreme Learning Machine |
RF | Random Forest |
LL | Lazy Learning |
EL | Eager Learning |
KR | Kernel Regression |
| [1] | HU Jiawei, WANG Tong, WANG Zengping. Collaborative emergency control strategy of system transient stability after DC blocking [J]. Power System Protection and Control, 2023, 51(4): 43-52. |
| [2] | XIANG Yuwei, WANG Tong, LI Congcong, et al. Strategy of emergency generator tripping control for transient stability after a large capacity HVDC blocking fault [J]. Power System Protection and Control, 2021, 49(15): 84-92. |
| [3] | HAN Zelei, JU Ping, QIN Chuan, et al. Review and prospect of research on frequency security of new power system [J]. Electric Power Automation Equipment, 2023, 43(09): 112-124. |
| [4] | SHI Xiang, LIU Hongbo, XU Xingwei, et al. Study of impact of boiler’s dynamic characteristics on dynamic frequency process in power system [J]. Electric Power Automation Equipment, 2007, 27(5): 69-72. |
| [5] | WANG Yizhen, MA Shiying, WANG Qing, et al. Dynamic frequency response characteristics of large thermal power generation units [J]. Power System Technology, 2013, 37(1): 106-111. |
| [6] | BEVRANI H, GHOSH A, LEDWICH G. Renewable energy sources and frequency regulation: survey and new perspectives [J]. IET Renewable Power Generation, 2010, 4(5): 438-457. |
| [7] | MOGHADDAM S Z. Generation and transmission expansion planning with high penetration of wind farms considering spatial distribution of wind speed [J]. International Journal of Electrical Power & Energy Systems, 2019, 106(3): 232-241. |
| [8] | CHAN M L, DUNLOP R D, SCHWEPPW F. Dynamic equivalents for average system frequency behavior following major disturbances [J]. IEEE Transactions on Power Apparatus and Systems, 1972, 91(4): 1637-1642. |
| [9] | ANDERSON P M, MIRHEYDAR M. A low-order system frequency response model [J]. IEEE Transactions on Power Systems, 1990, 5(3): 720–729. |
| [10] | LI Changgang, LIU Yutian, ZHANG Hengxu, et al. Power system frequency response analysis based on the direct current load flow [J]. Proceedings of the CSEE, 2009, 29(34): 36-41. |
| [11] | ALIZADEH M, AMRAEE T. Adaptive scheme for local prediction of post-contingency power system frequency [J]. Electric Power Systems Research, 2014, 107(5): 240–249. |
| [12] | BO Qibin, WANG Xiaoru, LIU Ketian. Minimum frequency prediction based on v-SVR for post-disturbance power system [J]. Electric Power Automation Equipment, 2015, 35(7): 83-88. |
| [13] | XU Y, DAI Y, DONG Z, et al. Extreme learning machine-based predictor for real-time frequency stability assessment of electric power systems [J]. Neural Computing and Applications, 2013, 22(1): 501-508. |
| [14] | WEN Yunfeng, ZHAO Rongzhen, XIAO Youqiang, et al. Frequency safety assessment of power system based on multi-layer extreme learning machine [J]. Automation of Electric Power Systems, 2019, 43(1): 133-140. |
| [15] | LI Guanzheng, LI Bin, WANG Shuai, et al. Dynamic frequency prediction of power system post-disturbance based on feature selection and random forest [J]. Power System Technology, 2021, 45(7): 2492-2502. |
| [16] | ZHAO Rongzhen, WEN Yunfeng, YE Xi, et al. Research on frequency indicators evaluation of disturbance events based on improved stacked denoising autoencoders [J]. Proceedings of the CSEE, 2019, 39(14): 4081-4093. |
| [17] | HUANG Mingzeng, WEN Yunfeng, GOU Jing, et al. Maximum frequency deviation prediction method considering frequency deviation distribution and penalty cost [J]. Automation of Electric Power Systems, 2021, 45(23): 51-59. |
| [18] | LI H, LI C, LIU Y, Maximum frequency deviation assessment with clustering based on metric learning [J]. International Journal of Electrical Power & Energy Systems, 2020, 120. |
| [19] | JI Haoran, HOU Chunping, YANG Yang, et al. New design of self-explosive insulator detection model based on generative adversarial network [J]. Modern Electric Power, 2022, 39(5): 587-596. |
| [20] | CHENG Zhuo, XU Yixun, LI Zeshuang. Research on multi-time scale optimization scheduling strategy of microgrid based on improved generative adversarial network for wind and PV power scenario generation [J]. Modern Electric Power, 2023, 40. |
| [21] | YORINO N, ABDILLAH M, SASAKI Y. Robust power system security assessment under uncertainties using bi-level optimization [J]. IEEE Transactions on Power Systems, 2018, 33(1): 352–362. |
| [22] | BIEIMAN L. Bagging predictors [J]. Machine Learning, 1996, 26(2): 123-140. |
| [23] | BELLET A, HABRARD A, SEBBAN M. A survey on metric learning for feature vectors and structured data. |
| [24] | WEINBERGER K Q, TESAURO G. Metric learning for kernel regression [J]. Journal of Machine Learning Research, 2007, 2(5): 612-619. |
| [25] | Yang Yanliang, Wang Xiuyun, Zeng Shuzhen, et al. Reactive power optimization based on improved gradient particle wwarm optimization algorithm [J]. Modern Electric Power, 2010, 27(4): 17-21. |
| [26] | Zhao Mingyu, Xu Shiming, Gao Hui, et al. Strategy of electric vehicle emergency power supply based on fuzzy k-means algorithm [J]. Automation of Electric Power Systems, 2016, 40(05): 91-95+108. |
| [27] | QI Sheng, SHAN Haiou, LUO Lin, et al. Application of deep feature learning with Gram's angle field for trace gas concentration identification [J]. Power System Protection and Control, 2023, 51(15): 55-65. |
APA Style
Huarui, L., Xinyao, Z., Yongyong, J., Zheng, L., Xiaobo, W. (2025). Data-Driven Frequency Security Assessment Based on Generative Adversarial Networks and Metric Learning. Frontiers, 5(1), 30-41. https://doi.org/10.11648/j.frontiers.20250501.12
ACS Style
Huarui, L.; Xinyao, Z.; Yongyong, J.; Zheng, L.; Xiaobo, W. Data-Driven Frequency Security Assessment Based on Generative Adversarial Networks and Metric Learning. Frontiers. 2025, 5(1), 30-41. doi: 10.11648/j.frontiers.20250501.12
AMA Style
Huarui L, Xinyao Z, Yongyong J, Zheng L, Xiaobo W. Data-Driven Frequency Security Assessment Based on Generative Adversarial Networks and Metric Learning. Frontiers. 2025;5(1):30-41. doi: 10.11648/j.frontiers.20250501.12
@article{10.11648/j.frontiers.20250501.12,
  author = {Li Huarui and Zhu Xinyao and Jia Yongyong and Li Zheng and Wang Xiaobo},
  title = {Data-Driven Frequency Security Assessment Based on Generative Adversarial Networks and Metric Learning},
  journal = {Frontiers},
  volume = {5},
  number = {1},
  pages = {30-41},
  doi = {10.11648/j.frontiers.20250501.12},
  url = {https://doi.org/10.11648/j.frontiers.20250501.12},
  eprint = {https://article.sciencepublishinggroup.com/pdf/10.11648.j.frontiers.20250501.12},
  abstract = {With construction of large-capacity direct current transmission projects and large-scale integration of renewable energy, frequency security of the power system is facing severe challenges. For fast and accurate online assessment of frequency security, a data-driven frequency security assessment model based on Generative Adversarial Network (GAN) and Metric Learning (ML) is proposed in this paper. Firstly, the key frequency security indicators are selected as the outputs of the model, and the input feature set is constructed. Then, distribution information of historical operation scenarios is learned through Wasserstein Generative Adversarial Network (WGAN), in order to generate operation scenarios covering typical operation modes for training sample set establishment. The generated operation scenarios are adjusted based on rejection sampling and resampling techniques, in order to increase the density of training samples near key scenes. Finally, considering inapplicability of a single assessment model for frequency security assessment in power systems with complicated changes of operation conditions, a combined assessment model for frequency security assessment composed of multiple sub-models is constructed based on Metric Learning for Kernel Regression (MLKR). The original distance metric is adjusted with metric learning techniques to make samples with similar frequency dynamics close. Then the samples with similar frequency dynamics are clustered into the same cluster, and the corresponding sub-model is established. A simplified Shandong power system example is used to verify the effectiveness of the proposed method.},
 year = {2025}
}
TY  - JOUR
T1  - Data-Driven Frequency Security Assessment Based on Generative Adversarial Networks and Metric Learning
AU  - Li Huarui
AU  - Zhu Xinyao
AU  - Jia Yongyong
AU  - Li Zheng
AU  - Wang Xiaobo
Y1  - 2025/01/24
PY  - 2025
N1  - https://doi.org/10.11648/j.frontiers.20250501.12
DO  - 10.11648/j.frontiers.20250501.12
T2  - Frontiers
JF  - Frontiers
JO  - Frontiers
SP  - 30
EP  - 41
PB  - Science Publishing Group
SN  - 2994-7197
UR  - https://doi.org/10.11648/j.frontiers.20250501.12
AB  - With construction of large-capacity direct current transmission projects and large-scale integration of renewable energy, frequency security of the power system is facing severe challenges. For fast and accurate online assessment of frequency security, a data-driven frequency security assessment model based on Generative Adversarial Network (GAN) and Metric Learning (ML) is proposed in this paper. Firstly, the key frequency security indicators are selected as the outputs of the model, and the input feature set is constructed. Then, distribution information of historical operation scenarios is learned through Wasserstein Generative Adversarial Network (WGAN), in order to generate operation scenarios covering typical operation modes for training sample set establishment. The generated operation scenarios are adjusted based on rejection sampling and resampling techniques, in order to increase the density of training samples near key scenes. Finally, considering inapplicability of a single assessment model for frequency security assessment in power systems with complicated changes of operation conditions, a combined assessment model for frequency security assessment composed of multiple sub-models is constructed based on Metric Learning for Kernel Regression (MLKR). The original distance metric is adjusted with metric learning techniques to make samples with similar frequency dynamics close. Then the samples with similar frequency dynamics are clustered into the same cluster, and the corresponding sub-model is established. A simplified Shandong power system example is used to verify the effectiveness of the proposed method.
VL  - 5
IS  - 1
ER  -
State Grid Jiangsu Electric Power Company Limited, Research Institute, Nanjing, China
State Grid Jiangsu Electric Power Company Limited, Research Institute, Nanjing, China
State Grid Jiangsu Electric Power Company Limited, Research Institute, Nanjing, China
State Grid Jiangsu Electric Power Company Limited, Research Institute, Nanjing, China
State Grid Jiangsu Electric Power Company Limited, Research Institute, Nanjing, China
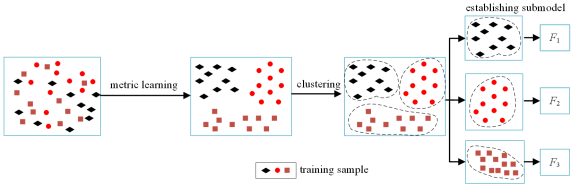
Figure 1. The establishment process of the combined assessment model for frequency security assessment.
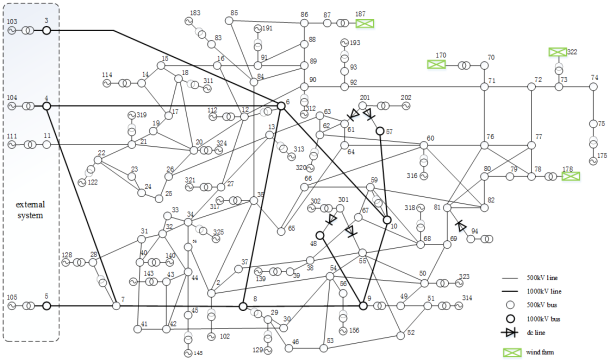
Figure 2. The single line diagram of simplified Shandong grid.
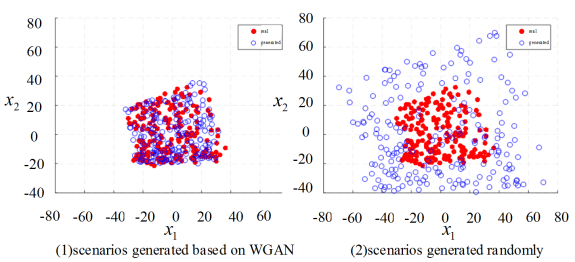
Figure 3. Comparison of scenario distributions with different scene generation methods.
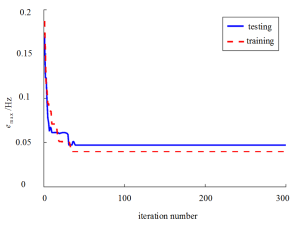
Figure 4. The variation of the assessment error in the process of MLKR learning.
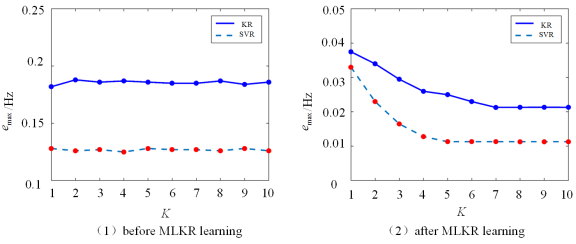
Figure 5. Error of the KR and SVR sub-models with different K before and after MLKR learning.
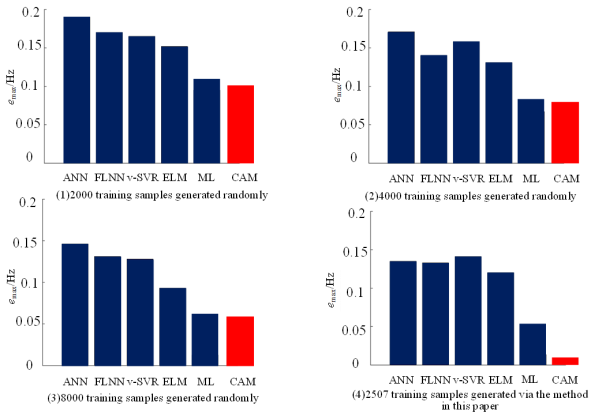
Figure 6. The test errors of different models with different training sample sets.
Information


