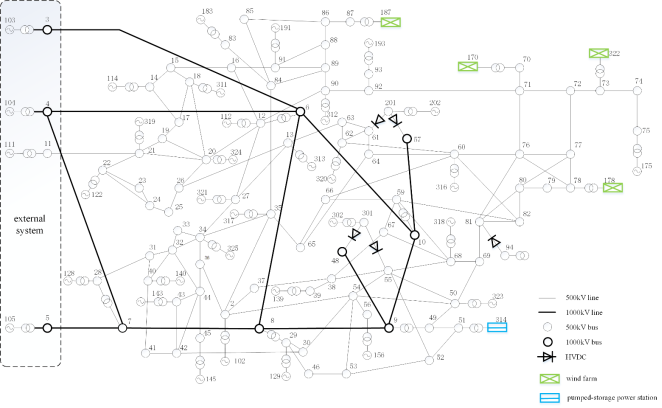
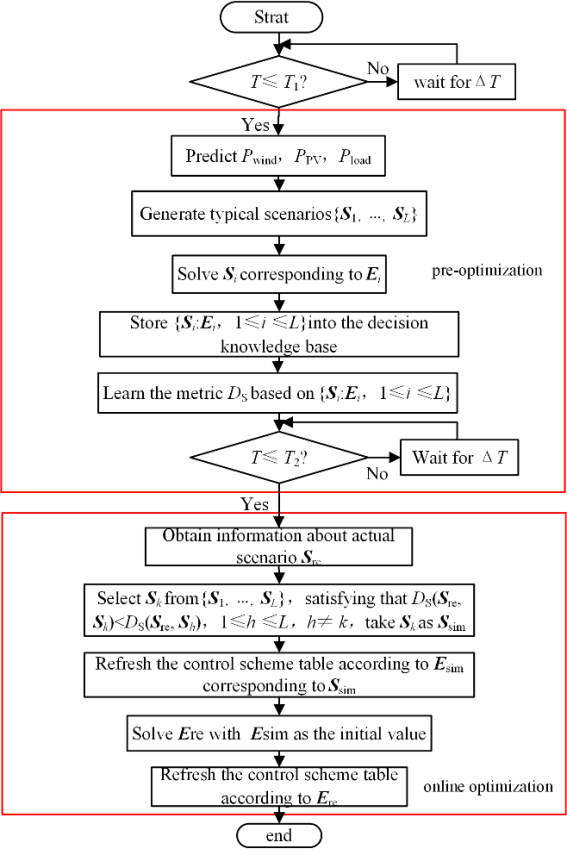
In view of the fact that the existing offline decision making methods cannot meet the requirements for accurate control of the actual operation mode under severe power disturbance events such as DC blocking, a two-stage optimization method of emergency control scheme including pre-optimization and online optimization is proposed by comprehensive application of time domain simulation and machine learning technology First, typical scenarios reflecting the possible future operation mode of the system are generated in the pre-optimization stage, and multi-resource coordination emergency control schemes in each scenario are optimized by using trajectory sensitivity and machine learning methods, and stored in the knowledge base In the online optimization stage, the information of the actual operation mode of the system is obtained. Based on metric learning, the appropriate control scheme is selected from the knowledge base as the initial value, and the optimal control scheme under the actual operation mode is obtained by rapid iterative optimization. A multi-dc fed terminal system is taken as an example to verify the effectiveness of the proposed method.
| Published in | Frontiers (Volume 5, Issue 1) |
| DOI | 10.11648/j.frontiers.20250501.13 |
| Page(s) | 42-52 |
| Creative Commons |
This is an Open Access article, distributed under the terms of the Creative Commons Attribution 4.0 International License (http://creativecommons.org/licenses/by/4.0/), which permits unrestricted use, distribution and reproduction in any medium or format, provided the original work is properly cited. |
| Copyright |
Copyright © The Author(s), 2025. Published by Science Publishing Group |
New Energy, Multi-Resource Coordination, Emergency Control, Two State Optimization, Frequency Security
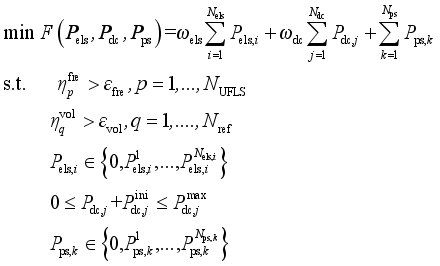
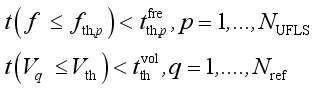 (1)
(1)  denotes the time delay of the pth round UFLS, Vq denotes the voltage of the qth reference node after DC blocking, Vth denotes the voltage threshold value, t(Vq≤Vth) denotes the time when Vq is lower than Vth,
  denotes the time threshold value related to voltage security indicator, NUFLS and Nref respectively denote the number of rounds of UFLS and reference nodes.
 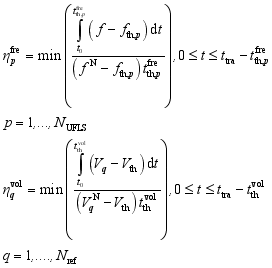 (2)
(2)  denotes the pth frequency security indicator obtained based on the frequency-time binary table relevant to UFLS, fN denotes the rated frequency of the system,
  denotes the voltage security indicator of the qth reference node obtained based on the voltage-time binary table,
  represents the rated voltage of the qth reference node, and ttra is the time duration of the considered transient process.
 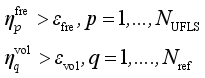 (3)
(3)  (4)
(4)  ], Pdc = [Pdc,1,…,
  ], Pps = [Pps,1,…,
  ].
].  denotes the amount load shedding corresponding to the removal of l feeder lines at the ith load control substation, Nels,i denotes the number of feeder lines at the ith load control substation,
  and
and  respectively denote the upper limit and the power before modulation of the jth DC. The amount of pumps that can be cut at each pumping and storage power station constitutes a discrete value set {0,
  , …,
, …,  }, where
  denotes the amount of pumps that can be cut at the kth pumping and storage power station corresponding to the removal of m pumping and storage units, and Nps,k is the number of units at the kth pumping and storage power station.
  , 1≤i≤L}. Then the corresponding scheme in the set {
  :
:  , 1≤i≤L} is taken as Esim. The initial value selection of scheme optimization which is difficult to solve directly is transformed into a similar scenario selection problem which is easy to solve. Reasonable initial value selection can significantly reduce the number of iterations of online optimization. In each iteration there is sufficient time to obtain accurate safety indicators based on time domain simulation to ensure the adaptability of the obtained scheme to the actual operation mode.
 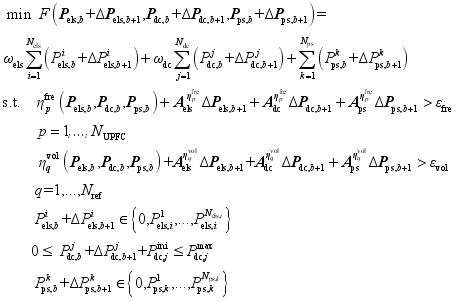 (5)
(5)  ,
,  and
and  respectively denotes the sensitivity vector composed of the sensitivity of the safety index
  to loads shed at each load control sub-station, power modulation of each DC, and pump shedding of pumped storage at each pumping and storage power station,
  ,
,  and
and  respectively denotes the sensitivity vector composed of the sensitivity of the safety index
  to loads shed at each load control sub-station, power modulation of each DC, and pump shedding of pumped storage at each pumping and storage power station.
  (6)
(6)  (7)
(7) 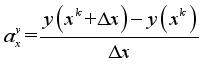 (8)
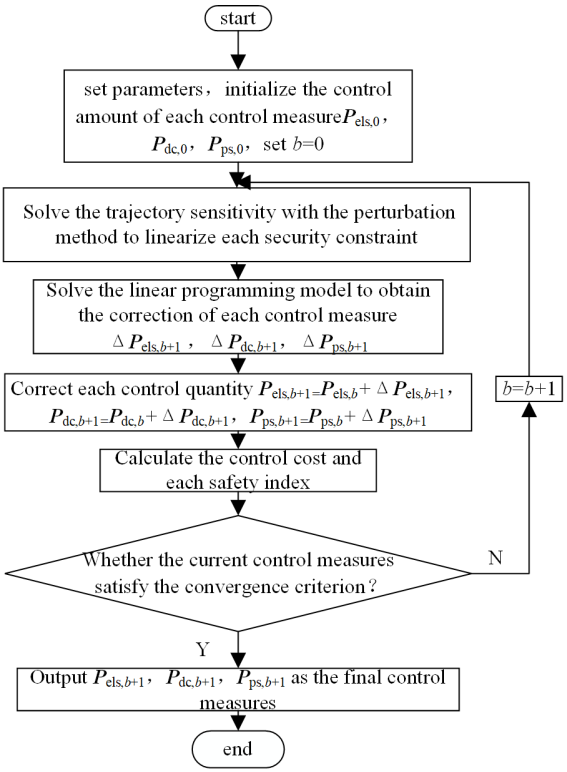
(8)  denotes the sensitivity of safety index y to the control quantity x of a control measure, y can be set
  or
or  , x can be the load shed at a load control sub-station, power modulation of a DC, or the cutting pump quantity of a pumping and storage power station, xk is the value of the control quantity at the kth iteration, Δx is the momentum, y(xk) denotes the value of safety index y with the control quantity xk.
 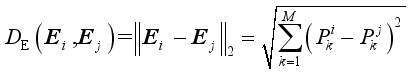 (9)
(9)  (10)
(10) 
 (11)
(11)  (12)
(12) 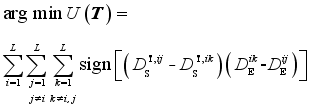 (13)
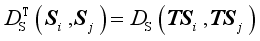
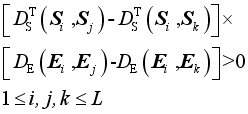
(13)  represents
  (S i, S j),
  represents
  (S i, S k),
  represents DE(
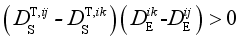 (14)
(14)  represents the regularization coefficient and
  >0.
>0. Solving process of the optimization problem |
|---|
Step 1 set q=1, seclect the scenario S i and the corresponding scheme Ei |
Step 2 seclect the scenario S j and Sk, satisfying that |
Step 3 calculate ( |
Step 4 repeat the above iterative process, until max(| |
frequency security indicator |
|
|
|
|
|---|---|---|---|---|
ηfre | 0.0003 | 0.00023 | 0.0007 | 0.00035 |
ηvol | 0.0002 | 0.00016 | 0.00076 | 0.0005 |
NTra | NBend |
|
| F |
|---|---|---|---|---|
0 | \ | -0.11313 | -0.11352 | 0 |
1 | 7 | 0.08523 | 0.08576 | 381.1 |
2 | 9 | 0.02134 | 0.02154 | 365.2 |
3 | 13 | 0.00751 | 0.00731 | 321.6 |
4 | 6 | 0.00103 | 0.00128 | 313.2 |
evaluation method | Ptotal | tcal | F | ηfre |
|---|---|---|---|---|
machine learnig | 5.61 GW | 12.5 s | 313.2 | 0.00128 |
time-domain simulation | 5.49 GW | 3818.2 s | 297.4 | 0.00101 |
 , and the most similar scene obtained by using
  measurement is the 119th scene.
 selection method | Nsce | Ptotal/GW | NTra | NBen | tcal/s | F | ηfre/×10-3 |
|---|---|---|---|---|---|---|---|
random | / | 5.41 | 8 | 45 | 2303 | 288 | 1.02 |
DS | 34 | 5.42 | 5 | 22 | 1089 | 289 | 1.03 |
| 119 | 5.41 | 2 | 3 | 136 | 287 | 1.02 |
frequency security indicator | the two-stage optimization method | RF | CNN |
|---|---|---|---|
Ptotal | 5.41 GW | 7.27 GW | 5.02 GW |
tcal | 136.7 s | 3.2 s | 2.1 s |
F | 287.6 | 389.9 | 221.8 |
ηfre | 0.00102 | 0.00278 | 0.00089 |
HVDC | High Voltage Direct Current |
UFLS | Under Frequency Load Shedding |
GAN | Generative Adversarial Network |
WGAN | Wasserstein Generative Adversarial Network |
| [1] | HONG Hanxiao, WU Chenxi, NI Suoyin. Optimal scheduling of new-type power system considering frequency-inertia security constraints [J/OL]. Electric Power Automation Equipment: 1-12 [2024-07-01]. |
| [2] | LIN Hengxian, HOU Kaiyuan, CHEN Lei, et al. Unit commitment of high-proportion of wind power system considering frequency safety constraints [J]. Power System Technology, 2021, 45(1): 1-9. |
| [3] | LUO Yazhou, CHEN Dezhi, LI Yiqun, et al. Design of system protection scheme for North China multi-UHV AC and DC strong coupling large receiving-end power grid [J]. Automation of Electric Power Systems, 2018, 42(22): 11-18. |
| [4] | CAO Yongji, ZHANG Hengxu, XIE Yuzheng, et al. Configuration scheme of emergency load shedding for HVDC receiving-end power grid based on transient low-frequency and high-voltage features [J]. Automation of Electric Power Systems, 2019, 43(6): 156-164. |
| [5] | XU Xin, ZHANG Hengxu, LI Changgang, et al. Emergency load shedding optimization algorithm based on trajectory sensitivity [J]. Automation of Electric Power Systems, 2016, 40(18): 143-148. |
| [6] | SUN Dayan, ZHOU Haiqiang, XIONG Haoqing, et al. Asensitivities analysis based emergency load shedding optimization method for the HVDC receiving end system [J]. Proceedings of the CSEE, 2018, 38(24): 7267-7275+7453. |
| [7] | ZHAO Jinquan, TANG Jianjun, WU Di, et al. Emergency coordination control strategy for transient voltage and transient frequency stability in HVDC infeed receiving-end power grid [J]. Automation of Electric Power Systems, 2020, 44(22): 45-53. |
| [8] | YUAN Sen, CHEN Dezhi, LUO Yazhou. Stability characteristics and coordinated control measures of multi-resource for DC blocking fault impacting weak AC channel [J]. Electric Power Automation Equipment, 2018, 38(8): 203-210. |
| [9] | LI Zhaowei, FANG Yongjie, HUANG Hui, et al. Coordinated control of cross-region DC frequency control and emergency power support in system protection [J]. Automation of Electric Power Systems, 2020, 44(22): 31-36. |
| [10] | BAO Yanhong, FENG Changyou, XU Taishan, et al. Online security and stability comprehensive auxiliary decision making of power system [J]. Automation of Electric Power Systems, 2015, 39(1): 104-110. |
| [11] | WANG Zengping, ZHU Shaoxuan, WANG Tong, et al. Research on stratified optimal load shedding strategy for receiving end power grid [J]. Transactions of China electrotechnical society, 2020, 35(5): 1128-1139. |
| [12] | WANG Changjiang, LI Xiaojing, JIA Chunhe, et al. Trajectory sensitivity based transient voltage two-stage control in AC/DC receiving end system [J]. Electric Power Automation Equipment, 2023, 43(07): 124-132. |
| [13] | ZHANG Zhe, QIN Boyu, GAO Xin, et al. Emergency control strategy of power grid voltage stability based on convolutional neural network and long short-term memory network [J]. Automation of Electric Power Systems, 2023, 47(11): 60-68. |
| [14] | GUO Ting, XIE Min, LIU Mingbo. Reduced space algorithm for model predictive transient voltage stability emergency control [J]. Proceedings of the CSEE, 2012, 32(16): 53-61. |
| [15] | BI Zhaodong, WANG Jianquan, HAN Zhenxiang. A fast load shedding algorithm based on integral sensitivity [J]. Power System Technology, 2002, 26(8): 4-7. |
| [16] | CHEN Qing, ZHOU Haiqiang, ZHU Bin, et al. Coordinated emergency load shedding control optimization algorithm [J]. Power System Technology, 2016, 40(4): 1044-1050. |
| [17] | WANG Tong, LIU Jiuliang, ZHU Shaoxuan, et al. Transient stability assessment and emergency control strategy based on random forest in power system [J]. Power System Technology, 2020, 44(12): 4694-4701. |
| [18] | ZHANG Hengxu, LI Changgang, LIU Yutian. Quantitative frequency security assessment method considering cumulative effect and its applications in frequency control [J]. International Journal of Electrical Power & Energy Systems, 2015, 65(65): 12-20. |
| [19] | CAO Yongji, ZHANG Hengxu, ZHANG Yi., et al. Event-driven fast frequency response control method for generator unit [J]. Automation of Electric Power Systems, 2021, 45(19): 148-154. |
| [20] | TIAN Xichen, GUO Hongye, LI Kexin, et al. Power source planning method satisfying unit cost recovery constraints under market environment [J]. Electric Power Automation Equipment, 2023, 43(05): 252-258. |
| [21] | LI Huarui, LI Changgang, LIU Yutian. Machine learning-based frequency security early warning considering uncertainty of renewable generation [J]. International Journal of Electrical Power & Energy Systems, 2022, 134. |
| [22] | FU Junpeng, CHEN Xiuhong, GE Xiaoqian. Uncorrelated linear discriminant analysis with L2,1-norm regulation and its application in face recognition [J]. Computer Engineering & Science, 2017, 39(02): 343-350. |
| [23] | CAO Zhen, ZHUANG Jun, XUE Jinhua, et al. Optimization of emergency control strategy for frequency of receiving-end power grid under DC blocking based on improved particle swarm optimization and hybrid convolutional neural network [J/OL]. Modern Electric Power: 1-12. [2024-02-01]. |
APA Style
Huarui, L., Xinyao, Z., Yongyong, J., Zheng, L., Xiaobo, W. (2025). Emergency Control Scheme Decision with Two-Stage Optimization for Hvdc Blocking. Frontiers, 5(1), 42-52. https://doi.org/10.11648/j.frontiers.20250501.13
ACS Style
Huarui, L.; Xinyao, Z.; Yongyong, J.; Zheng, L.; Xiaobo, W. Emergency Control Scheme Decision with Two-Stage Optimization for Hvdc Blocking. Frontiers. 2025, 5(1), 42-52. doi: 10.11648/j.frontiers.20250501.13
@article{10.11648/j.frontiers.20250501.13,
  author = {Li Huarui and Zhu Xinyao and Jia Yongyong and Li Zheng and Wang Xiaobo},
  title = {Emergency Control Scheme Decision with Two-Stage Optimization for Hvdc Blocking},
  journal = {Frontiers},
  volume = {5},
  number = {1},
  pages = {42-52},
  doi = {10.11648/j.frontiers.20250501.13},
  url = {https://doi.org/10.11648/j.frontiers.20250501.13},
  eprint = {https://article.sciencepublishinggroup.com/pdf/10.11648.j.frontiers.20250501.13},
  abstract = {In view of the fact that the existing offline decision making methods cannot meet the requirements for accurate control of the actual operation mode under severe power disturbance events such as DC blocking, a two-stage optimization method of emergency control scheme including pre-optimization and online optimization is proposed by comprehensive application of time domain simulation and machine learning technology First, typical scenarios reflecting the possible future operation mode of the system are generated in the pre-optimization stage, and multi-resource coordination emergency control schemes in each scenario are optimized by using trajectory sensitivity and machine learning methods, and stored in the knowledge base In the online optimization stage, the information of the actual operation mode of the system is obtained. Based on metric learning, the appropriate control scheme is selected from the knowledge base as the initial value, and the optimal control scheme under the actual operation mode is obtained by rapid iterative optimization. A multi-dc fed terminal system is taken as an example to verify the effectiveness of the proposed method.},
 year = {2025}
}
TY  - JOUR
T1  - Emergency Control Scheme Decision with Two-Stage Optimization for Hvdc Blocking
AU  - Li Huarui
AU  - Zhu Xinyao
AU  - Jia Yongyong
AU  - Li Zheng
AU  - Wang Xiaobo
Y1  - 2025/02/17
PY  - 2025
N1  - https://doi.org/10.11648/j.frontiers.20250501.13
DO  - 10.11648/j.frontiers.20250501.13
T2  - Frontiers
JF  - Frontiers
JO  - Frontiers
SP  - 42
EP  - 52
PB  - Science Publishing Group
SN  - 2994-7197
UR  - https://doi.org/10.11648/j.frontiers.20250501.13
AB  - In view of the fact that the existing offline decision making methods cannot meet the requirements for accurate control of the actual operation mode under severe power disturbance events such as DC blocking, a two-stage optimization method of emergency control scheme including pre-optimization and online optimization is proposed by comprehensive application of time domain simulation and machine learning technology First, typical scenarios reflecting the possible future operation mode of the system are generated in the pre-optimization stage, and multi-resource coordination emergency control schemes in each scenario are optimized by using trajectory sensitivity and machine learning methods, and stored in the knowledge base In the online optimization stage, the information of the actual operation mode of the system is obtained. Based on metric learning, the appropriate control scheme is selected from the knowledge base as the initial value, and the optimal control scheme under the actual operation mode is obtained by rapid iterative optimization. A multi-dc fed terminal system is taken as an example to verify the effectiveness of the proposed method.
VL  - 5
IS  - 1
ER  -
State Grid Jiangsu Electric Power Company Limited, Research Institute, Nanjing, China
Research Fields: frequency security of power system, voltage security of power system, economic dispatching of power system, planning and Operation of power system, dynamic simulation of power system
State Grid Jiangsu Electric Power Company Limited, Research Institute, Nanjing, China
Research Fields: frequency security of power system, voltage security of power system, economic dispatching of power system, planning and Operation of power system, dynamic simulation of power system
State Grid Jiangsu Electric Power Company Limited, Research Institute, Nanjing, China
State Grid Jiangsu Electric Power Company Limited, Research Institute, Nanjing, China
State Grid Jiangsu Electric Power Company Limited, Research Institute, Nanjing, China
Information


 <
< <
< ,(
,( -
- )(
)( ,
, ,
, ) to update T, set q=q+1
 -
- |)<ε and |Qq+1-Qq|<μ,1≤m≤N,1≤n≤N,