Abstract
Model simulation accuracy is essential for understanding climate change and its socioeconomic effects. Twenty global climate models that were a part of the Coupled Model Intercomparison Project Phase 6 (CMIP6) were assessed in this study. The main goal was to assess and determine which models performed best in capturing rainfall patterns over Ethiopia between 1981 and 2014. The Correlation Coefficient (CC), Root Mean Square Error (RMSE), and PBIAS were used to evaluate the performance of CMIP6-GCM. The findings showed that the majority of CMIP6 models mostly reproduced the features of the ENACTS climatology pattern for total rainfall. Furthermore, rainfall over the study area was underestimated in six out of twenty CMIP6 models. The models that overestimate rainfall the most are MRI-ESM2-0, INM-CM4-8, and CESM2_WACCM, whereas the models that underestimate rainfall the most are CNRM-ESM2-1, ACCESS-CM2, and MPI-ESM1-2-LR. Every model has a correlation coefficient that falls between 0.6 and 0.99. The top six models with greater correlation coefficient (CC) values and higher performance out of 20 are the MPI-ESM1-2-LR (0.99), BCC-CSM2-MR (0.98), MIROC-ES2L (0.96), NorESM2-MM (0.96), and EC_Earth3_CC (0.96). All models, except IITM-ESM and MRI-ESM2-0, have root mean square errors below 5mm, strong correlation with ENACTS values, PBIAS range -3.94-4.3, and RMSE and PBIAS values near optimal 0. The significance of determining the optimal performance models for extreme rainfall events over the study area, both now and in the future, is underscored by these findings.
Keywords
Annual Rainfall, CMIP6, Model Evaluation, Ethiopia
1. Introduction
Climate change is one of the most dangerous problems facing the world today, both in terms of its universal context and how it responds to environmental and socioeconomic forces
| [1] | D. Fenta Mekonnen and M. Disse, “Analyzing the future climate change of Upper Blue Nile River basin using statistical downscaling techniques,” Hydrol. Earth Syst. Sci., vol. 22, no. 4, pp. 2391-2408, 2018. |
[1]
. The sixth assessment report (AR6) shows that the scope and intensity of climate change impact are greater than predicted by earlier assessments. Due to climate change, there has been widespread degradation of ecosystem resilience, and natural adaptive capacity, as well as alterations in seasonal timing
| [2] | P. Critto and A. C. Change, “Impacts, Adaptation and Vulnerability,” Clim. Chang. Impacts Adapt. Vulnerability Approaches, vol. 8, pp. 419-429, 2009. |
[2]
. Because it has caused the climate system to undergo unprecedented change, it has increased weather severity and frequency temperature and precipitation patterns which will affect the spatial-temporal hydrological cycle
| [3] | R. Singh and B. Biswal, “Assessing the impact of climate change on water resources: the challenge posed by a multitude of options,” Hydrol. a Chang. World Challenges Model., pp. 185-204, 2019. |
[3]
.
Africa is among the continents most affected by climate change and is particularly susceptible to its effects, such as drought and floods brought on by rising air temperatures and shifting precipitation patterns, which threaten agriculture, water security, and socioeconomic development
| [4] | V. Ongoma and H. Chen, “Temporal and spatial variability of temperature and precipitation over East Africa from 1951 to 2010,” Meteorol. Atmos. Phys., vol. 129, pp. 131-144, 2017. |
| [5] | B. Ayugi et al., “Comparison of CMIP6 and CMIP5 models in simulating mean and extreme precipitation over East Africa,” Int. J. Climatol., vol. 41, no. 15, pp. 6474-6496, 2021. |
| [6] | G. T. Yengoh and J. Ardö, “Climate change and the future heat stress challenges among smallholder farmers in East Africa,” Atmosphere (Basel)., vol. 11, no. 7, p. 753, 2020. |
[4-6]
. Meteorology Institute (EMI) study highlights Ethiopia's climate change adaptation impacts as food insecurity, water-borne disease outbreaks, land degradation, and infrastructure damage
| [7] | A. Ababa, “Climate change national adaptation programme of action (Napa) of Ethiopia,” Natl. Meteorol. Serv. Agency, Minist. Water Resour. Fed. Democr. Repub. Ethiop. Addis Ababa, 2007. |
[7]
.
The Coupled Model Intercomparison Project of global climate models (CMIP-GCMs) is a widely used technique for studying climate change's impacts on water resources using three-dimensional grids
| [8] | P. N. Edwards, “History of climate modeling,” Wiley Interdiscip. Rev. Clim. Chang., vol. 2, no. 1, pp. 128-139, 2011. |
[8]
. CMIP-GCMs are crucial for understanding Earth's climate, but their coarse resolutions limit their use to global or regional scales. Proper application, downscaling, and bias correction can improve local climate understanding and water resource planning
| [9] | E. Soriano, L. Mediero, and C. Garijo, “Selection of bias correction methods to assess the impact of climate change on flood frequency curves,” Water, vol. 11, no. 11, p. 2266, 2019. |
[9]
.
The challenge of predicting future climate has increased the need for climate modeling and its use, as numerous models are available worldwide, and evaluation criteria depend on model selection goals
| [10] | A. F. Lutz, H. W. ter Maat, H. Biemans, A. B. Shrestha, P. Wester, and W. W. Immerzeel, “Selecting representative climate models for climate change impact studies: an advanced envelope-based selection approach,” Int. J. Climatol., vol. 36, no. 12, pp. 3988-4005, 2016. |
[10]
. The CMIP aims to consolidate diverse climate model development efforts from various institutions worldwide, reducing the cumbersome process of inter-comparison between models
| [11] | R. McSweeney and Z. Hausfather, “Q&A: How do climate models work?,” Carbon Br., vol. 15, 2018. |
[11]
. Sixth CMIP framework models have been released, focusing on improvements in setups, resolutions, scenarios, and parameterization factors at each stage.
| [5] | B. Ayugi et al., “Comparison of CMIP6 and CMIP5 models in simulating mean and extreme precipitation over East Africa,” Int. J. Climatol., vol. 41, no. 15, pp. 6474-6496, 2021. |
[5]
.
The CMIP6 archive currently holds model output results from more than 30 climate research centers found on different continents throughout the globe. Each model is different; thus, the outputs generated for the same experiments and scenarios are different
| [12] | R. L. Wilby, “Evaluating climate model outputs for hydrological applications,” Hydrol. Sci. Journal-Journal des Sci. Hydrol., vol. 55, no. 7, pp. 1090-1093, 2010. |
[12]
. As a result, not all models perform well in certain locations. This is why there is a need to evaluate the capabilities of models and select those that have better performances in describing the local climate
| [13] | T. S. Khayyun, I. A. Alwan, and A. M. Hayder, “Selection of suitable precipitation CMIP-5 sets of GCMs for Iraq using a symmetrical uncertainty filter,” in IOP Conference Series: Materials Science and Engineering, IOP Publishing, 2020, p. 12013. |
[13]
.
In practice, one climate model (or a small ensemble of climate models) is selected for climate change impact studies. In most cases, the selection could be based on a single criterion or a whole set of criteria. Climate models are often selected based on their skills to simulate the present and (near) past climate. This approach is known as the past performance approach. Another approach is called the envelop approach, where models covering a wide range of projections for one or more climate variables of interest are selected from the pool of available models
| [14] | R. Homsi et al., “Precipitation projection using a CMIP5 GCM ensemble model: a regional investigation of Syria,” Eng. Appl. Comput. Fluid Mech., vol. 14, no. 1, pp. 90-106, 2020. |
[14]
.
To date, there is no clearly defined methodology to be used for evaluating and selecting a single or a group of climate models. The selection method and process mainly depend on the aim of the study and the variables involved
| [10] | A. F. Lutz, H. W. ter Maat, H. Biemans, A. B. Shrestha, P. Wester, and W. W. Immerzeel, “Selecting representative climate models for climate change impact studies: an advanced envelope-based selection approach,” Int. J. Climatol., vol. 36, no. 12, pp. 3988-4005, 2016. |
[10]
. Most of the works to date have used statistical or data mining techniques. Moreover, there is a difference in the output (single or ensemble model), analysis period (daily, monthly, seasonal, and annual), and level (station, grid, regional, or spatially averaged).
Previous climate change projection efforts in Ethiopia focused on putting into use a few randomly selected climate models without thoroughly evaluating their capability to simulate the climate system in Ethiopia. Therefore, the novelty of this study was addressing this shortcoming through the execution of more robust evaluation criteria that mainly relied on the application of statistical and data mining techniques. The main outcome of this study will be identifying a model or models that have an overall good performance in Ethiopia. In addition, a prediction of future climate conditions with the newly selected model will be performed later and compared with similar earlier findings in Ethiopia.
2. Materials and Methods
2.1. Description of the Study Area
2.1.1. Location and Topography
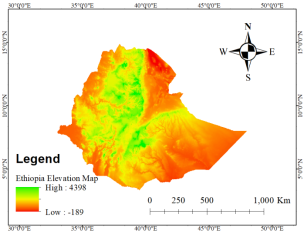
Ethiopia is a landlocked country in the Great Horn of Africa with complex topography located roughly between 32°58'00" E and 48°00'00" E longitude and 3°25'00" N and 14°55'00" N latitude. Ethiopia is a country of 1,104,300 Square kilometers, bordered to the north by Eritrea, to the east by Djibouti and Somalia, to the west by Sudan and South Sudan, and to the south by Kenya. This study area is delineated using a 30m*30m resolution Digital Elevation Model (DEM). The elevation within the study area spans from 189m under mean sea level to 4398m above mean sea level, with the middle regions being at higher elevations, while the border area is at lower elevations. The lowest elevation area was found on the Northeastern tip of Ethiopia.
Figure 1. Map of the study area.
2.1.2. Climate
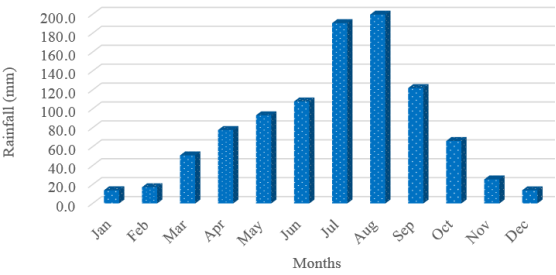
Based on the report of the National Meteorological Agency of Ethiopia (1996, 2004), the country has three distinct seasons. The main rainy season also known as the wet season is called Kiremt, and spans from June to September. The second small rainy season is known as Belg which covers from February to May and the dry season is called Bega covers from October to January.
The Belg season is a secondary rainy season in the northeast, central, and highlands of the south and east but it is the primary rain season over the lowlands of south and southeast Ethiopia. The western half of the country and the highlands of southern Ethiopia receive more than 1,000mm annual rainfall. Whereas, the annual total rainfall is below 500mm over the lowlands of northeastern and southeastern Ethiopia.
In Ethiopia, the main rainy season, known as Kiremt, usually lasts from June to September.
Figures 2 and 5 display the long-term monthly average rainfall temporal variation and spatial distribution of annual average rainfall over the country respectively. The Bega season is expected to bring dry, windy, and cold weather to most parts of Ethiopia, with recorded daily minimum temperatures reaching their peak. The ONDJ period marks the second rainy season for the Southern and Southeastern regions.
Figure 2. Long-term monthly mean rainfall of the study area (1981-2020).
2.2. Materials
A tool called the Climate Data Operator (CDO) is used to downscale GCM data into RCM data, combine many time-stamp simulated climate data, choose the simulated climate data for the study period, and convert different coarse resolutions into comparable fine resolutions. Climate Data Tool (CDT) was used to examine the quality of the data and evaluate the performance. An established program for extracting simulated climate data along with the locations of weather stations is called Studio, and it works with the R programming language.
2.3. Datasets
The Ethiopian Meteorological Institute (EMI), the International Research Institute for Climate and Society (IRI), and the University of Reading collaborated on the development of ENACTS, a three-track system designed to generate high-resolution gridded climate data time series
| [15] | X. Fan, Q. Duan, C. Shen, Y. Wu, and C. Xing, “Evaluation of historical CMIP6 model simulations and future projections of temperature over the Pan-Third Pole region,” Environ. Sci. Pollut. Res., vol. 29, no. 18, pp. 26214-26229, 2022, https://doi.org/10.1007/s11356-021-17474-7 |
[15]
. Two primary types of data are used to create the ENACTS climate dataset. Data on station rainfall from EMI-managed national weather stations makes up the first dataset. High-quality, controlled ground-based station data from over 600 rain gauge stations was provided by the EMI. The European Organization for the Exploitation of Meteorological Satellites provides rainfall estimates via satellite, which makes up the second dataset.
The best feasible satellite rainfall estimates were produced by calibrating TAMSAT satellite rainfall data over Ethiopia using more than 600 high-quality controlled station data. Station rainfall data are utilized to fill in the temporal and spatial gaps in station observations by evaluating and correcting inaccuracies in the spatially complete products. From 1981 to 2020, ENACTS covers Ethiopia with a spatial resolution of 0.0375° x 0.0375°. Therefore, to assess how well the CMIP6 models performed in simulating rainfall parameters over Ethiopia from 1981 to 2014, the ENACTS gridded dataset was employed as an observation reference in this work.
CMIP6 model data
In this study, the observed reference gridded datasets for the period from 1981 to 2014 were analyzed using the monthly and annual precipitation data of 20 CMIP6 historical simulated model outputs. From Earth System Grid Federation archives (https://esgf-node.llnl.gov/search/cmip6), rainfall simulation data of 20 CMIP6 models were downloaded.
Table 1 provides information on the CMIP6 models' model type, horizontal resolution, and country.
Table 1. List of the CMIP6 GCM data utilized in this study.
Climate Model | Resolution | Country |
ACCESS-CM2 | 1.875 x 1.25 | Australia |
BCC-CSM2-MR | 1.13 x 1.13 | China |
CMCC-CM2-HR4 | 1.25 x 0.94 | Italy |
CNRM-ESM2-1 | 1.4 x 1.4 | France |
CNRM-CM6-1-HR | 0.5 x 0.5 | France |
GFDL-ESM4 | 1.25 x 1.00 | USA |
HadGEM3-GC31-MM | 0.8x 0.55555 | UK |
IITM-ESM | 1.9 x 1.9 | Indian |
INM-CM5-0 | 2.0 x 1.5 | Russia |
MIROC-ES2L | 2.8125 x 2.79 | Japan |
MPI-ESM1-2-LR | 1.9 x 1.9 | Germany |
MRI-ESM2-0 | 1.13 x 1.13 | Japan |
NorESM2-MM | 1.25 x 0.94 | Norway |
TaiESM1 | 1.25 x 0.94 | Taiwan |
2.4. Evaluation of CMIP6 Model
Table 2. Description of quantitative statistical measures.
Statistics | Formula | Range | Unit | Perfect Score |
Root Mean Square Error | | 0-∞ | mm | 0 |
Correlation Coefficient | | -1 to +1 | mm | +1 |
Percent of Bias | | 0 | % | 0 |
The abilities of the CMIP6 models to replicate the climate properties of the study area were assessed using spatial comparisons. Since the resolutions are different for most models and observations, all data were re-gridded to a common grid of 0.0375° x 0.0375° resolution (ENACTS grid) using the bilinear interpolation method to confirm uniform resolution. The performance of each model in simulating rainfall was also evaluated using statistical metrics. Statistical metrics used for this study included correlation coefficient (r), root-mean-squared error (RMSE), and percent of bias (PBIAS) for the period 1981-2014. These statistical metrics will be chosen to evaluate the performance of climate models, which are often employed in numerous regions, including Ethiopia
. The statistical metric formulas are depicted in
Table 2.
3. Results and Discussions
3.1. Climate Model Evaluation and Selection
For evaluating the effects of climate change in particular areas, like Ethiopia, choosing the right climate model is essential. Studies on the effects of climate change usually concentrate on how different climate variables-such as temperature, precipitation, humidity, and so on-affect ecosystems, water resources, agriculture, and public health.
Ethiopia's climate model selection is crucial due to its unique topography and susceptibility to climate fluctuations. Key criteria include simulating important processes like El Niño-Southern Oscillation, replicating past climates accurately, and providing estimates for multiple Representative Concentration Pathways or Shared Socioeconomic Pathways to evaluate greenhouse gas emissions.
Multiple methods are used to evaluate the model's performance. The selection and evaluation of climate models for impact analysis over Ethiopia in this work has been based on the link between the simulated climate model and the rainfall of ENACTs as observed, utilizing data from twenty various GCM-CMIP6 climate models. In this study, twenty climate models were compared using ENACTS data from January 1, 1981, to December 31, 2014, using the following statistical comparison measures: percent of bias (PBIAS), Root Mean Square Error (RMSE), and Correlation Coefficient (Correl). The correlation coefficient values of all models ranged between 0.62 and 0.99. This value indicated that all model data have a positive relationship with the ENACTS data source. The ENACTS and simulated MPI-ESM1-2-LR showed a stronger relationship based on the correlation analysis results. All models, except for the two IITM-ESM and MRI-ESM2-0 models, have root mean square errors of less than 5mm. The percentage of bias indicated a strong correlation between the simulated and ENACTS values. The computed range of the PBIAS value is -3.94 to 4.3. Both the statistical metrics values of RMSE and PBIAS are almost approaching the optimal value which is 0. The statistical comparison metrics values for twenty climate model data sets compared to ENACT data are displayed in
Table 3.
Table 3. The monthly performance evaluation statistical value of CMIP6 climate model output and ranks.
CMIP6 | Monthly Mean | Correl (-) | Rank (Correl) | RMSE | Rank (RMSE) | PBIAS | Rank (PBIAS) |
ENACTS | 81.5 | - | - | - | - | - | - |
ACCESS-CM2 | 53.4 | 0.84 | 16 | 2.75 | 7 | 3.76 | 2 |
BCC-CSM2-MR | 101.2 | 0.98 | 2 | 1.89 | 15 | -0.58 | 14 |
CanESM5 | 74.3 | 0.89 | 15 | 3.35 | 5 | 2.98 | 4 |
CESM2_WACCM | 108.0 | 0.90 | 14 | 0.81 | 20 | 0.10 | 13 |
CMCC_CM2_SR5 | 100.2 | 0.81 | 17 | 3.86 | 3 | 1.43 | 9 |
CMCC-CM2-HR4 | 85.0 | 0.76 | 18 | 2.21 | 14 | 3.41 | 3 |
CNRM-ESM2-1 | 48.7 | 0.63 | 19 | 1.41 | 17 | 2.42 | 7 |
EC_Earth3_CC | 89.7 | 0.96 | 5 | 3.01 | 6 | 4.30 | 1 |
GFDL-ESM4 | 95.8 | 0.94 | 6 | 1.13 | 19 | 1.58 | 8 |
HadGEM3-GC31-MM | 93.9 | 0.91 | 10 | 2.67 | 10 | -0.62 | 15 |
IITM-ESM | 90.0 | 0.94 | 7 | 15.51 | 1 | -3.94 | 20 |
INM_CM4_8 | 107.8 | 0.91 | 9 | 1.68 | 16 | -0.74 | 18 |
INM-CM5-0 | 93.9 | 0.91 | 10 | 2.67 | 10 | -0.62 | 15 |
MIROC-ES2L | 98.9 | 0.96 | 3 | 2.75 | 8 | 0.86 | 10 |
MPI-ESM1-2-LR | 61.3 | 0.99 | 1 | 2.40 | 13 | 2.57 | 6 |
MRI-ESM2-0 | 113.3 | 0.93 | 8 | 9.15 | 2 | -3.01 | 19 |
NorCPM1 | 78.6 | 0.62 | 20 | 1.30 | 18 | 0.69 | 12 |
NorESM2-MM | 98.9 | 0.96 | 3 | 2.75 | 8 | 0.86 | 10 |
SAM0_UNICON | 70.6 | 0.90 | 13 | 3.48 | 4 | 2.62 | 5 |
TaiESM1 | 93.9 | 0.91 | 10 | 2.67 | 10 | -0.62 | 15 |
In comparison to the baseline period (1981-2014) of ENACTs data, ACCESS-CM2, CanESM5, CNRM-ESM2-1, MPI-ESM1-2-LR, NorCPM1, and SAM0_UNICON underestimated in both monthly and annual mean areal rainfall, while the remaining others 14 simulated CMIP6 are overestimated. MPI-ESM1-2-LR, BCC-CSM2-MR, MIROC-ES2L, NorESM2-MM, EC_Earth3_CC, and GFDL-ESM4 are the top six climate models out of 20 for the Ethiopian region based on statistical metrics of correlation coefficient values. Based on RMSE measures, EC_Earth3_CC, CanESM5, SAM0_UNICON, CMCC_CM2_SR5, MRI-ESM2-0, and IITM-ESM are the top six climate models over the study region. On the other hand, the top six climate models ranked by PBIAS statistical metrics are the PBIAS EC_Earth3_CC, ACCESS-CM2, CMCC-CM2-HR4, CanESM5, and MPI-ESM1-2-LR climate models.
3.2. Mean Monthly and Annual Total Rainfall
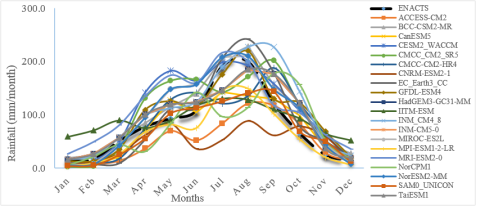
This study first examined the characteristics of the monthly and annual rainfall rate over Ethiopia as simulated by CMIP6 against the ENACTS data. The monthly mean of model simulation and annual mean difference between simulated and ENACTS are presented in
Figures 2 and 3. The months of June - September (JJAS) are wet seasons over most of the region. In Ethiopia, the total monthly mean of ENACTS and model rainfall data peaks in August (part of the Kiremt season) and May (part of the Belg season) (
Figure 2). When we compared to ENACTS, the climate model outputs were overestimated in most climate models and underestimated in six of them from 20 CMIP6 models. By comparison with ENACTS, the monthly mean rainfall was overestimated with a range of 3.4 to 31.7mm and underestimated from 3.0 to 32.8mm. The majority of models projected a unique increase on Belg seasons.
Figure 3. Long-term mean monthly rainfall of ENACTS and 20 CMIP6 models in Ethiopia for the period 1981-2014.
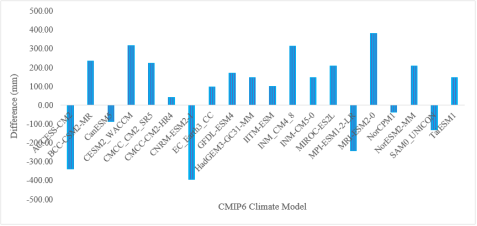
Figure 4. The difference between historical climate model data and ENACTS data.
Results of statistical analysis of the 20 CMIP6 models concerning ENACTS indicated that CNRM-ESM2-1 mean annual rainfall of the country was underestimated at 393.53mm and MRI-ESM2-0 overestimated at 380.84mm. In general, the mean annual simulated rainfall difference from ENACTS data ranged between -393.53mm to 380.84mm.
3.3. Spatial Distribution of Annual Rainfall
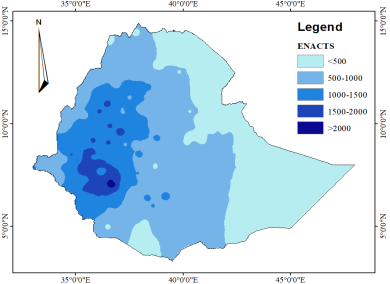
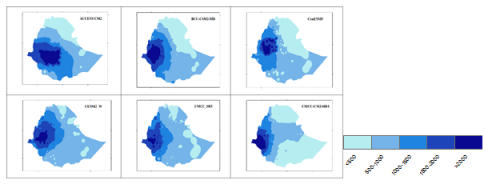
The country's center of western regions has shown a higher amount of annual rainfall. However, the country's central, northwest, and southern regions-followed by the central western regions-have also demonstrated high rainfall levels. In general, more than 1000mm of rainfall was noted in this area. Such a spatial distribution of observed rainfall across Ethiopia could largely be captured by ENACTS and most CMIP6 models. Nonetheless, every model could accurately depict the nation's high annual rainfall levels in the West and Northwest as well as the low levels in the Southeast and South lowlands. Conversely, using ENACTS as a comparison, six models (ACCESS-ESM1-5, CanESM5, CNRM-ESM2-1, MPI-ESM1-2-LR, NorCPM1, and SAM0_UNICON) underestimated the 34-year annual average rainfall. The spatial rainfall distribution of ENACTS and global climate model results were presented in
Figure 5 and
Figure 6 respectively. Most eastern and southern parts of the country show less than 500mm amount of rainfall based on the ENACTS dataset. Some models such as CMCC-CM2-HR4, MIROC-ES2L, and NorESM2 also indicated less spatial distributions in the most eastern and few southern parts of the country.
Figure 5. ENACTS annual rainfall spatial distribution over the study area.
Figure 6. Annual rainfall spatial distribution of CMIP6 climate model.
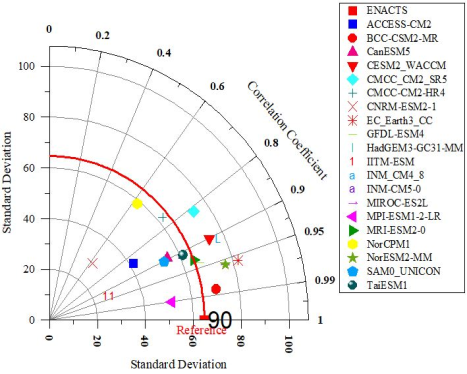
The models' accuracy in adjusting for the observed monthly mean patterns was summarized by the plotting of a Taylor diagram. Variations in IITM-ESM, CNRM-ESM2-1, ACCESS-CM2, NorCPM1, CMCC-CM2-HR4, and CMCC-CM2_SR5 were significantly greater than the observed pattern across the entire time, although the remaining variables showed minimal spatial variability. Spatial correlations ran from 0.6 to 0.9 in all models. Reproducing annual rainfall was a higher performance of most models overall (
Figure 7).
Figure 7. Taylor diagram of mean monthly-simulated rainfall concerning ENACTS over Ethiopia from 1981-2014.
4. Conclusion and Recommendation
The world is facing serious dangers from climate change, especially in Africa where it aggravates problems like food insecurity, flooding, and drought. The objective of this research is to improve Ethiopia's assessment and choice of climate models, leading to more precise climate condition projections. This paper documents the performances of the 20 CMIP6 GCMs' historical rainfall simulations over Ethiopia. The temporal patterns of rainfall total validated using three statistical metrics concerning ENACTS as reference datasets. The validation was carried out at the national level from 1981-2014. The statistical metrics such as CC, bias, and RMSE showed most models scored the highest skills over most parts of Ethiopia. The majority of models considered in this study overestimated rainfall amounts over most parts of the Ethiopian. Furthermore, except ACCESS-ESM1-5, CanESM5, CNRM-ESM2-1, MPI-ESM1-2-LR, NorCPM1, and SAM0_UNICON during, other 14 CMIP6 examined over-estimated total rainfall over most parts of the country.
The findings of this study give essential information to model developers and end-users of the datasets. The country's economy will greatly benefit from further research and in-depth analyses aimed at addressing the subpar performance of models that result in sources of dry biases, as their likelihood is projected to grow in the future. Users of climate model outputs should exercise caution when using the models in annual studies of climate change since annual rainfall simulations have dry bias. As a result, bias correction is necessary before using the models in studies of future climate projections and impacts. Notwithstanding the study's strong results, there are certain restrictions.
This study has many limitations even with its strong findings. Given that there are significant annual variations in various parts of Ethiopia, one of the constraints is the selection of the annual rainfall for each location. To do more analyses of the model performance, this study advises comparing the various CMIP6 models using several homogenous rainfall zones across the nation. The findings can be used as a guide for the upcoming phase of climate models across the country and provide insightful information about the various performances of the CMIP6 models across the entire nation.
Abbreviations
CMIP6 | Coupled Model Intercomparison Project Phase 6 |
CC | Correlation Coefficient |
RMSE | Root Mean Square Error |
DEM | Digital Elevation Model |
CDO | Climate Data Operator |
EMI | Ethiopian Meteorological Institute |
IRI | Research Institute for Climate and Society |
Author Contributions
Ajebush Gochaw Ayele is the sole author. The author read and approved the final manuscript.
Conflicts of Interest
The author declares no conflicts of interest.
References
| [1] |
D. Fenta Mekonnen and M. Disse, “Analyzing the future climate change of Upper Blue Nile River basin using statistical downscaling techniques,” Hydrol. Earth Syst. Sci., vol. 22, no. 4, pp. 2391-2408, 2018.
|
| [2] |
P. Critto and A. C. Change, “Impacts, Adaptation and Vulnerability,” Clim. Chang. Impacts Adapt. Vulnerability Approaches, vol. 8, pp. 419-429, 2009.
|
| [3] |
R. Singh and B. Biswal, “Assessing the impact of climate change on water resources: the challenge posed by a multitude of options,” Hydrol. a Chang. World Challenges Model., pp. 185-204, 2019.
|
| [4] |
V. Ongoma and H. Chen, “Temporal and spatial variability of temperature and precipitation over East Africa from 1951 to 2010,” Meteorol. Atmos. Phys., vol. 129, pp. 131-144, 2017.
|
| [5] |
B. Ayugi et al., “Comparison of CMIP6 and CMIP5 models in simulating mean and extreme precipitation over East Africa,” Int. J. Climatol., vol. 41, no. 15, pp. 6474-6496, 2021.
|
| [6] |
G. T. Yengoh and J. Ardö, “Climate change and the future heat stress challenges among smallholder farmers in East Africa,” Atmosphere (Basel)., vol. 11, no. 7, p. 753, 2020.
|
| [7] |
A. Ababa, “Climate change national adaptation programme of action (Napa) of Ethiopia,” Natl. Meteorol. Serv. Agency, Minist. Water Resour. Fed. Democr. Repub. Ethiop. Addis Ababa, 2007.
|
| [8] |
P. N. Edwards, “History of climate modeling,” Wiley Interdiscip. Rev. Clim. Chang., vol. 2, no. 1, pp. 128-139, 2011.
|
| [9] |
E. Soriano, L. Mediero, and C. Garijo, “Selection of bias correction methods to assess the impact of climate change on flood frequency curves,” Water, vol. 11, no. 11, p. 2266, 2019.
|
| [10] |
A. F. Lutz, H. W. ter Maat, H. Biemans, A. B. Shrestha, P. Wester, and W. W. Immerzeel, “Selecting representative climate models for climate change impact studies: an advanced envelope-based selection approach,” Int. J. Climatol., vol. 36, no. 12, pp. 3988-4005, 2016.
|
| [11] |
R. McSweeney and Z. Hausfather, “Q&A: How do climate models work?,” Carbon Br., vol. 15, 2018.
|
| [12] |
R. L. Wilby, “Evaluating climate model outputs for hydrological applications,” Hydrol. Sci. Journal-Journal des Sci. Hydrol., vol. 55, no. 7, pp. 1090-1093, 2010.
|
| [13] |
T. S. Khayyun, I. A. Alwan, and A. M. Hayder, “Selection of suitable precipitation CMIP-5 sets of GCMs for Iraq using a symmetrical uncertainty filter,” in IOP Conference Series: Materials Science and Engineering, IOP Publishing, 2020, p. 12013.
|
| [14] |
R. Homsi et al., “Precipitation projection using a CMIP5 GCM ensemble model: a regional investigation of Syria,” Eng. Appl. Comput. Fluid Mech., vol. 14, no. 1, pp. 90-106, 2020.
|
| [15] |
X. Fan, Q. Duan, C. Shen, Y. Wu, and C. Xing, “Evaluation of historical CMIP6 model simulations and future projections of temperature over the Pan-Third Pole region,” Environ. Sci. Pollut. Res., vol. 29, no. 18, pp. 26214-26229, 2022,
https://doi.org/10.1007/s11356-021-17474-7
|
| [16] |
T. H. Alemseged and R. Tom, “Evaluation of regional climate model simulations of rainfall over the Upper Blue Nile basin,” Atmos. Res., vol. 161-162, pp. 57-64, 2015,
https://doi.org/10.1016/j.atmosres.2015.03.013
|
Cite This Article
-
APA Style
Ayele, A. G. (2025). Evaluation and Selection of the CMIP6 Climate Model over Ethiopia. International Journal of Atmospheric and Oceanic Sciences, 9(2), 90-98. https://doi.org/10.11648/j.ijaos.20250902.12
 Copy
|
Copy
|
 Download
ACS Style
Ayele, A. G. Evaluation and Selection of the CMIP6 Climate Model over Ethiopia. Int. J. Atmos. Oceanic Sci. 2025, 9(2), 90-98. doi: 10.11648/j.ijaos.20250902.12
Copy
|
Download
AMA Style
Ayele AG. Evaluation and Selection of the CMIP6 Climate Model over Ethiopia. Int J Atmos Oceanic Sci. 2025;9(2):90-98. doi: 10.11648/j.ijaos.20250902.12
Copy
|
Download
-
@article{10.11648/j.ijaos.20250902.12,
  author = {Ajebush Gochaw Ayele},
  title = {Evaluation and Selection of the CMIP6 Climate Model over Ethiopia
},
  journal = {International Journal of Atmospheric and Oceanic Sciences},
  volume = {9},
  number = {2},
  pages = {90-98},
  doi = {10.11648/j.ijaos.20250902.12},
  url = {https://doi.org/10.11648/j.ijaos.20250902.12},
  eprint = {https://article.sciencepublishinggroup.com/pdf/10.11648.j.ijaos.20250902.12},
  abstract = {Model simulation accuracy is essential for understanding climate change and its socioeconomic effects. Twenty global climate models that were a part of the Coupled Model Intercomparison Project Phase 6 (CMIP6) were assessed in this study. The main goal was to assess and determine which models performed best in capturing rainfall patterns over Ethiopia between 1981 and 2014. The Correlation Coefficient (CC), Root Mean Square Error (RMSE), and PBIAS were used to evaluate the performance of CMIP6-GCM. The findings showed that the majority of CMIP6 models mostly reproduced the features of the ENACTS climatology pattern for total rainfall. Furthermore, rainfall over the study area was underestimated in six out of twenty CMIP6 models. The models that overestimate rainfall the most are MRI-ESM2-0, INM-CM4-8, and CESM2_WACCM, whereas the models that underestimate rainfall the most are CNRM-ESM2-1, ACCESS-CM2, and MPI-ESM1-2-LR. Every model has a correlation coefficient that falls between 0.6 and 0.99. The top six models with greater correlation coefficient (CC) values and higher performance out of 20 are the MPI-ESM1-2-LR (0.99), BCC-CSM2-MR (0.98), MIROC-ES2L (0.96), NorESM2-MM (0.96), and EC_Earth3_CC (0.96). All models, except IITM-ESM and MRI-ESM2-0, have root mean square errors below 5mm, strong correlation with ENACTS values, PBIAS range -3.94-4.3, and RMSE and PBIAS values near optimal 0. The significance of determining the optimal performance models for extreme rainfall events over the study area, both now and in the future, is underscored by these findings.},
 year = {2025}
}
Copy
|
Download
-
TY  - JOUR
T1  - Evaluation and Selection of the CMIP6 Climate Model over Ethiopia

AU  - Ajebush Gochaw Ayele
Y1  - 2025/08/12
PY  - 2025
N1  - https://doi.org/10.11648/j.ijaos.20250902.12
DO  - 10.11648/j.ijaos.20250902.12
T2  - International Journal of Atmospheric and Oceanic Sciences
JF  - International Journal of Atmospheric and Oceanic Sciences
JO  - International Journal of Atmospheric and Oceanic Sciences
SP  - 90
EP  - 98
PB  - Science Publishing Group
SN  - 2640-1150
UR  - https://doi.org/10.11648/j.ijaos.20250902.12
AB  - Model simulation accuracy is essential for understanding climate change and its socioeconomic effects. Twenty global climate models that were a part of the Coupled Model Intercomparison Project Phase 6 (CMIP6) were assessed in this study. The main goal was to assess and determine which models performed best in capturing rainfall patterns over Ethiopia between 1981 and 2014. The Correlation Coefficient (CC), Root Mean Square Error (RMSE), and PBIAS were used to evaluate the performance of CMIP6-GCM. The findings showed that the majority of CMIP6 models mostly reproduced the features of the ENACTS climatology pattern for total rainfall. Furthermore, rainfall over the study area was underestimated in six out of twenty CMIP6 models. The models that overestimate rainfall the most are MRI-ESM2-0, INM-CM4-8, and CESM2_WACCM, whereas the models that underestimate rainfall the most are CNRM-ESM2-1, ACCESS-CM2, and MPI-ESM1-2-LR. Every model has a correlation coefficient that falls between 0.6 and 0.99. The top six models with greater correlation coefficient (CC) values and higher performance out of 20 are the MPI-ESM1-2-LR (0.99), BCC-CSM2-MR (0.98), MIROC-ES2L (0.96), NorESM2-MM (0.96), and EC_Earth3_CC (0.96). All models, except IITM-ESM and MRI-ESM2-0, have root mean square errors below 5mm, strong correlation with ENACTS values, PBIAS range -3.94-4.3, and RMSE and PBIAS values near optimal 0. The significance of determining the optimal performance models for extreme rainfall events over the study area, both now and in the future, is underscored by these findings.
VL  - 9
IS  - 2
ER  -
Copy
|
Download