Research Article | | Peer-Reviewed

Evaluation of Coupled Model Intercomparison Project Phase 6 (CMIP6) Model Capability to Predict Rainfall over Ethiopia

Received: 14 July 2025     Accepted: 28 July 2025     Published: 13 August 2025
Views:       Downloads:
Abstract

There is a need for accurate climate model simulations to understand climate change and its socioeconomic implications. The main objective of this study was to evaluate the performance of twenty global climate models from Coupled Model Intercomparison Project Phase 6 (CMIP6) over Ethiopia. Enhancing National Climate Services (ENACTS) and Climate models rainfall data from 1981 to 2014 were utilized for model performance evaluation in this study. The performances of the models were evaluated with statistical metrics of Correlation Coefficient (CC), Root Mean Square Error (RMSE), and Percent Bias (PBIAS). The findings of this study indicated that most models had similar trends with the ENACTS. Among twenty climate models, six models such as ACCESS-ESM1-5, CanESM5, CNRM-ESM2-1, MPI-ESM1-2-LR, NorCPM1, and SAM0_UNICON underestimated the rainfall. Based on the statistical metrics values of correlation coefficient (CC), MPI-ESM1-2-LR (0.99), BCC-CSM2-MR (0.98), MIROC-ES2L (0.96), NorESM2-MM (0.96), and EC_Earth3_CC (0.96) are best performing models. For all models but IITM-ESM and MRI-ESM2-0, RMSE values were below 5 mm and PBIAS values were within a desirable range (-3.94 to 4.3). These results underscore the importance of selecting appropriate models for evaluating climate impacts, particularly for extreme rainfall events over Ethiopia.

Published in International Journal of Atmospheric and Oceanic Sciences (Volume 9, Issue 2)
DOI 10.11648/j.ijaos.20250902.13
Page(s) 99-111
Creative Commons

This is an Open Access article, distributed under the terms of the Creative Commons Attribution 4.0 International License (http://creativecommons.org/licenses/by/4.0/), which permits unrestricted use, distribution and reproduction in any medium or format, provided the original work is properly cited.

Copyright

Copyright © The Author(s), 2025. Published by Science Publishing Group

Keywords

Annual and Monthly Rainfall, CMIP6, Model Evaluation, Ethiopia

1. Introduction
Climate change is one of the world's most pressing problems with devastating environmental and socioeconomic implications, particularly in Africa . Ethiopia, a geographically diverse nation with heterogeneous climates, is highly vulnerable to the adverse effects of climate change, including altered precipitation patterns, prolonged droughts, and increased weather conditions. These effects have serious implications on key sectors such as agriculture, water resources, and public health .
Global Climate Models (GCMs) are critical tools for understanding and projecting climate variability. The Coupled Model Intercomparison Project (CMIP) provides a framework to evaluate climate models, with the most recent iteration, CMIP6, producing better simulations using finer spatial resolutions and sophisticated parameterizations . However, model performance varies by region with the variation of model physics, parameterizations, and spatial resolutions . Hence, selecting the most appropriate CMIP6 models for Ethiopia is crucial in providing reliable climate projections and guiding climate adaptation strategies.
Past climate projection, studies over Ethiopia have reliably relied on randomly selected models with no intensive analysis of their performances . In response to this shortfall, this research systematically compares twenty CMIP6 models against high resolution Enhancing National Climate Services (ENACTS) datasets as observed using stringent statistical analyses, including the correlation coefficient (CC), root mean square error (RMSE), and percent bias (PBIAS). The primary objective is to identify models capable of simulating best historical rainfall patterns over Ethiopia and thereby enhancing the quality of climate impact assessments.
Through the comparison of model simulations and high-resolution ENACTS datasets, this study aims to provide a more precise set of climate models for Ethiopia. The findings will be a valuable resource for researchers, policymakers, and stakeholders working on climate impact studies, water resource planning, and agricultural planning.
2. Materials and Methods
2.1. Description of the Study Area
2.1.1. Location and Topography
Ethiopia is a landlocked country in the Greater Horn of Africa with a complicated and varied landscape. Its overall area is 1,104,300 square kilometres, and it is roughly located between 32°58'00" E and 48°00'00" E longitude and 3°25'00" N and 14°55'00" N latitude. It borders Sudan and South Sudan to the west, Kenya to the south, Djibouti and Somalia to the east, and Eritrea to the north.
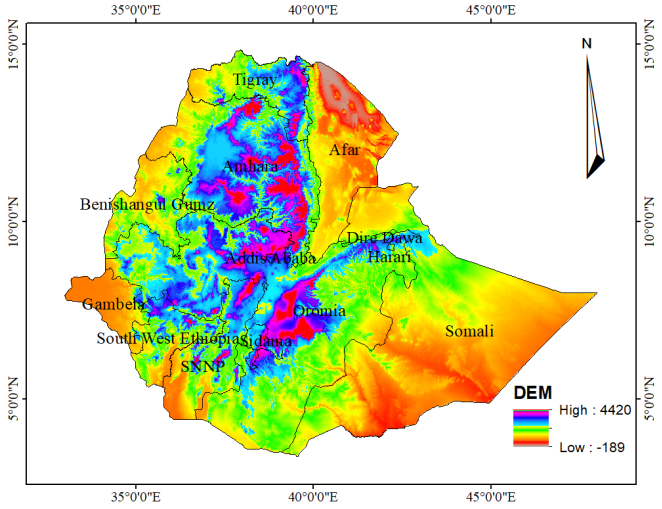
Figure 1. Map of the study area.
A Digital Elevation Model (DEM) with a resolution of 30 m x 30 m is utilized to define the study area. This area has elevations ranging from 189 meters below mean sea level to 4,398 meters above mean sea level. Higher altitudes are found in Ethiopia's centre regions, but lower elevations are more noticeable along the country's borders. The northeastern extremity of the nation is where the study area's lowest point is situated. The location, topography, and regions of the study area are illustrated in Figure 1.
2.1.2. Climate
Based on Ethiopian Meteorology Institute (1996, 2004), the country experiences three distinct seasons. The primary rainy season, referred to as Kiremt, extends from June to September and contributes the highest amount of annual rainfall. Another rainy period, known as Belg, occurs between February and May and serves as a secondary rainy season in the northeast, central regions, and the highlands of the south and east. However, for the lowlands in the south and southeast, Belg is the principal rainy season. The dry season, called Bega, spans from October to January.
Rainfall distribution across Ethiopia varies significantly. The western half and the southern highlands receive over 1,000 mm of rainfall annually, whereas the lowlands in the northeast and southeast receive less than 500 mm per year. The seasonal variation in rainfall is well illustrated in Figure 2, which depict the long-term monthly rainfall trends and the spatial distribution of annual average rainfall across the country.
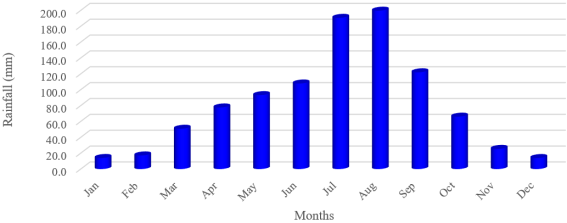
Figure 2. Long-term monthly mean rainfall of the study area (1981-2020).
2.2. Materials and Tools
Climate Data Operator (CDO) is a very powerful software used to handle climate data, particularly for downscaling Global Climate Model (GCM) data into Regional Climate Model (RCM) data for this study. The tool supports the merging of multiple time-stamped climate simulations, extracting appropriate climate data for a specific study period, and converting coarse-resolution data into finer and comparable resolutions for in-depth analysis.
RStudio, an R programming integrated development environment, is utilized for the extraction and processing of simulated climate data. It facilitates data manipulation, visualization, and statistical evaluation with the capability to integrate weather station data to provide full climatic analysis.
2.3. Ethiopia's Enhancing National Climate Services (ENACTS) Datasets
The Ethiopian Meteorological Institute (EMI), together with the International Research Institute for Climate and Society (IRI) and the University of Reading, developed ENACTS a three-tier framework for producing high-resolution gridded climate data time series . The dataset integrates two primary sources of data: ground station measurements and satellite-borne rainfall estimates.
The first dataset consists of high-quality, controlled rain gauge measurements from over 600 Ethiopia Meteorology Institute (EMI) operated rain gauge stations, offering firm and trustworthy in situ observations. The second dataset consists of satellite rainfall estimates of the European Organization for the Exploitation of Meteorological Satellites. These satellite-based estimates are subsequently calibrated using TAMSAT (Tropical Applications of Meteorology using Satellite Data and Ground-Based Observations) and utilize the ground station data of EMI to improve the accuracy. It efficiently fills up spatial and temporal gaps in the observations from the stations by addressing discrepancies in climate products on the grid.
Covering 1981-2020 at a high spatial resolution of 0.0375° x 0.0375°, ENACTS is a valuable climate analysis reference dataset. In this study, it was utilized as an observation reference to benchmark the performance of CMIP6 models in simulating Ethiopia's rainfall pattern during 1981-2014.
Coupled Model Intercomparison Project Phase 6 (CMIP6) Model Datasets
In this study, the observed reference gridded datasets for the period from 1981 to 2014 were analyzed using the monthly and annual precipitation data of twenty CMIP6 historical simulated model outputs. From Earth System Grid Federation archives (https://esgf-node.llnl.gov/search/cmip6), first member realization outputs (r1i1p1f1) monthly rainfall simulation data of 20 CMIP6 models were downloaded. Table 1 provides information on the CMIP6 models' model type, horizontal resolution, and country.
Table 1. List of the CMIP6-GCM data utilized in this study.

No

Climate Model

Resolution

Institution

Country

1

ACCESS-CM2

1.875° x 1.25°

CSIRO

Australia

2

BCC-CSM2-MR

1.13° x 1.13°

BBC

China

3

CanESM5

2.8° x 2.8°

CCCma

Canada

4

CESM2_WACCM

1.3 °x 0.9°

CESM2/WACCM

USA

5

CMCC_CM2_SR5

1.25° x 0.9°

CMCC

Italy

6

CMCC-CM2-HR4

1.25° x 0.94°

CMCC

Italy

7

CNRM-ESM2-1

1.4° x 1.4°

CNRM/CERFACS

France

8

EC_Earth3_CC

0.7° x 0.7°

EC-Earth

Europe

9

GFDL-ESM4

1.25° x 1.00°

NOAA-GFDL

USA

10

HadGEM3-GC31-MM

0.8° x 0.6°

MOHC

UK

11

IITM-ESM

1.9° x 1.9°

IITM

Indian

12

INM_CM4_8

2.0° x 1.5°

INM

Russia

13

INM-CM5-0

2.0° x 1.5°

INM

Russia

14

MIROC-ES2L

2.8 °x 2.8°

MIROC

Japan

15

MPI-ESM1-2-LR

1.9° x 1.9°

MPI-M

Germany

16

MRI-ESM2-0

1.13° x 1.13°

MRI

Japan

17

NorCPM1

2.5° x 1.9°

NorCPM

Norway

18

NorESM2-MM

1.25° x 0.94°

NCC

Norway

19

SAM0_UNICON

0.8° x 0.5°

SNU

Korea

20

TaiESM1

1.25° x 0.94°

CcliCS

Taiwan

2.4. Evaluation of CMIP6 Model
Table 2. Description of quantitative statistical measures.

Statistics

Formula

Range

Unit

Perfect Score

Root Mean Square Error

RMSE=t=1NRCMIP6-RENACTs2N

0-∞

mm

0

Correlation Coefficient

r=t=1NRCMIP6-R̅CMIP6RENACTS-R̅ENACTst=1NRCMIP6-R̅CMIP6RENACTs-R̅ENACTs

-1 to +1

mm

+1

Percent of Bias

PBias=RCMIP6-RENACTs̅R̅ENACTs*100%

0

%

0

The abilities of the CMIP6 models to replicate the climate properties of the study area were assessed using spatial comparisons. Since the resolutions are different for most models and observations, all data were re-gridded to a common grid of 0.0375° x 0.0375° resolution (ENACTS grid) using the bilinear interpolation method to confirm uniform resolution. The performance of each model in simulating rainfall was also evaluated using statistical metrics. Statistical metrics used for this study-included correlation coefficient (r), root-mean-squared error (RMSE), and percent of bias (PBIAS) for the period 1981-2014. These statistical metrics will choose to evaluate the performance of climate models, which are often employed in numerous regions, including Ethiopia . The statistical metric formulas are depicted in Table 2.
3. Results and Discussions
3.1. Climate Model Evaluation and Selection
For evaluating the effects of climate change in particular areas, like Ethiopia, choosing the right climate model is essential. Studies on the effects of climate change usually concentrate on how different climate variables such as temperature, precipitation, humidity, wind speed affect ecosystems, water resources, agriculture, and public health .
Ethiopia's climate model selection is crucial due to its unique topography and susceptibility to climate fluctuations . Key criteria include simulating important processes like El Niño-Southern Oscillation, replicating past climates accurately, and providing estimates for multiple Representative Concentration Pathways or Shared Socioeconomic Pathways to evaluate greenhouse gas emissions .
Multiple methods are used to evaluate the model's performance. The selection and evaluation of climate models for impact analysis over the Ethiopia in this work has been based on the relation between the simulated climate model and the rainfall of ENACTs as observed, utilizing data from twenty various GCM-CMIP6 climate models. In this study, twenty climate models were compared using ENACTS data from January 1, 1981 to December 31, 2014, using the following statistical metrics comparison measures: percent of bias (PBIAS), Root Mean Square Error (RMSE), and Correlation Coefficient (Correl). The correlation coefficient values of all models ranged between 0.62 and 0.99. This value indicated that all model data are a positive relationship with ENACTS data source. The ENACTS and simulated MPI-ESM1-2-LR showed a stronger relationship based on the correlation analysis results. All models, with the exception of the two IITM-ESM and MRI-ESM2-0 models, have root mean square errors of less than 5 mm. The percentage of bias indicated a strong correlation between the simulated and ENACTS values. The computed range of the PBIAS value is -3.94 to 4.3. Both the statistical metrics values of RMSE and PBIAS are almost approach to the optimal values that is 0. The statistical comparison metrics values for twenty climate model data sets compared to ENACTS data are displayed in Table 3.
Table 3. The monthly performance evaluation statistical value of CMIP6 climate model output and ranks.

CMIP6

Monthly Mean

Correl (-)

Rank (Correl (-))

RMSE

Rank (RMSE)

PBIAS

Rank (PBIAS)

ENACTS

81.5

-

-

-

-

-

-

ACCESS-CM2

53.4

0.84

16

2.75

7

3.76

2

BCC-CSM2-MR

101.2

0.98

2

1.89

15

-0.58

14

CanESM5

74.3

0.89

15

3.35

5

2.98

4

CESM2_WACCM

108.0

0.90

14

0.81

20

0.10

13

CMCC_CM2_SR5

100.2

0.81

17

3.86

3

1.43

9

CMCC-CM2-HR4

85.0

0.76

18

2.21

14

3.41

3

CNRM-ESM2-1

48.7

0.63

19

1.41

17

2.42

7

EC_Earth3_CC

89.7

0.96

5

3.01

6

4.30

1

GFDL-ESM4

95.8

0.94

6

1.13

19

1.58

8

HadGEM3-GC31-MM

93.9

0.91

10

2.67

10

-0.62

15

IITM-ESM

90.0

0.94

7

15.51

1

-3.94

20

INM_CM4_8

107.8

0.91

9

1.68

16

-0.74

18

INM-CM5-0

93.9

0.91

10

2.67

10

-0.62

15

MIROC-ES2L

98.9

0.96

3

2.75

8

0.86

10

MPI-ESM1-2-LR

61.3

0.99

1

2.40

13

2.57

6

MRI-ESM2-0

113.3

0.93

8

9.15

2

-3.01

19

NorCPM1

78.6

0.62

20

1.30

18

0.69

12

NorESM2-MM

98.9

0.96

3

2.75

8

0.86

10

SAM0_UNICON

70.6

0.90

13

3.48

4

2.62

5

TaiESM1

93.9

0.91

10

2.67

10

-0.62

15

In comparison to the baseline period (1981-2014) of ENACTs data, ACCESS-CM2, CanESM5, CNRM-ESM2-1, MPI-ESM1-2-LR, NorCPM1, and SAM0_UNICON underestimated in both monthly and annual mean areal rainfall, while the remaining others 14 simulated CMIP6 are overestimated. MPI-ESM1-2-LR, BCC-CSM2-MR, MIROC-ES2L, NorESM2-MM, EC_Earth3_CC, and GFDL-ESM4 are the top six climate models out of 20 for the Ethiopian region based on statistical metrics of correlation coefficient values. MPI-ESM1-2-LR, BCC-CSM2-MR, MIROC-ES2L, NorESM2-MM, EC_Earth3_CC, and GFDL-ESM4 as top-performing models according to correlation coefficient agrees with , who found MPI-ESM1-2-LR and EC_Earth3_CC to be two of the most reliable models in simulating Ethiopian rainfall variability. Some studies, such as , suggest that models like NorESM2-MM have limitations in simulating seasonal precipitation patterns.
Based on RMSE measures, EC_Earth3_CC, CanESM5, SAM0_UNICON, CMCC_CM2_SR5, MRI-ESM2-0, and IITM-ESM are the top six climate models over the study region. The ranking of the models according to RMSE (i.e., EC_Earth3_CC, CanESM5, SAM0_UNICON, CMCC_CM2_SR5, MRI-ESM2-0, and IITM-ESM) is partially supported by , who identified EC_Earth3_CC and MRI-ESM2-0 as top performers over Eastern Africa but indicated that CanESM5 has large biases over some regions.
On the other hand, the top six climate models ranked by PBIAS statistical metrics are EC_Earth3_CC, ACCESS-CM2, CMCC-CM2-HR4, CanESM5, and MPI-ESM1-2-LR. This is consistent with , who found that EC_Earth3_CC and MPI-ESM1-2-LR had relatively lower biases in simulating historical precipitation trends. Similarly, identified biases in precipitation simulations by CMIP6, where models like CanESM5 and MPI-ESM1-2-LR exhibited notable differences.
Several studies have already assessed the proficiency of CMIP6 models in simulating East African and Ethiopian precipitation. For instance, intercompared a number of CMIP6 models and found that the majority of the models overestimated precipitation, which aligns with this study showing 14 out of 20 models overestimating rainfall compared to ENACTs data.
3.2. Mean Monthly and Annual Rainfall
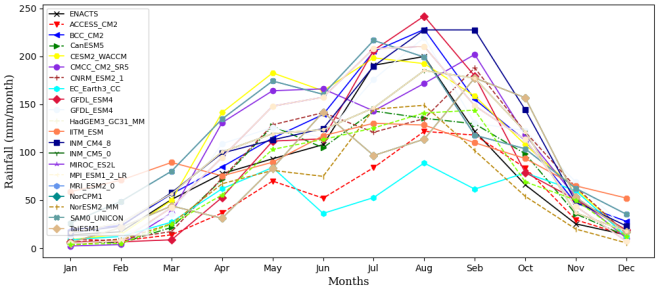
Figure 3. Long-term mean monthly rainfall of ENACTS and 20 CMIP6 models in Ethiopia for the period 1981-2014.
This study used CMIP6 model simulations against the ENACTS dataset to analyses the monthly and annual rainfall parameters over Ethiopia. In line with other research, the results indicate that rainfall peaks happen in August (Kiremt season) and May (Belg season) . However, with the exception of six models that showed underestimation, model outputs typically overestimated rainfall. The underestimation ranged from 3.0 to 32.8 mm, and the overestimation ranged from 3.4 to 31.7 mm. noted similar biases in CMIP5 models, suggesting ongoing difficulties with climate model rainfall simulations across Ethiopia. Furthermore, a number of CMIP6 models predicted higher rainfall during the Belg season, which is consistent with research by that indicates higher precipitation trends during specific seasons because of climate variability. The average monthly rainfall of ENACTS and 20 CMIP6 models in Ethiopia over the period 1981-2014 were depicted in Figure 3.
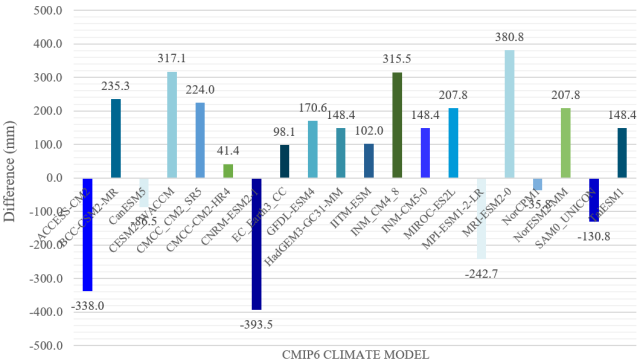
Figure 4. Mean annual rainfall difference between historical CMIP6 and ENACTS data (1981-2014).
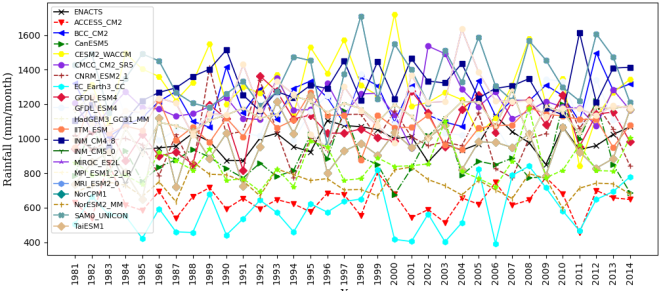
Figure 5. Historical ENACTS and CMIP6 annual rainfall time series over Ethiopia (1981-2014).
Results of statistical analysis of the 20 CMIP6 models with respect to ENACTS indicated that CNRM-ESM2-1 mean annual rainfall of the country underestimated with 393.5 mm and MRI-ESM2-0 overestimated with 380.8 mm (Figure 4). In general, the mean annual simulated rainfall difference from ENACTS data was ranged between -393.5 mm to 380.84 mm (Figure 4). The historical annual rainfall time series of ENACTS and 20 CMIP6 model data from 1981 to 2014 were plotted in Figure 5.
3.3. Spatial Distribution of Annual Rainfall
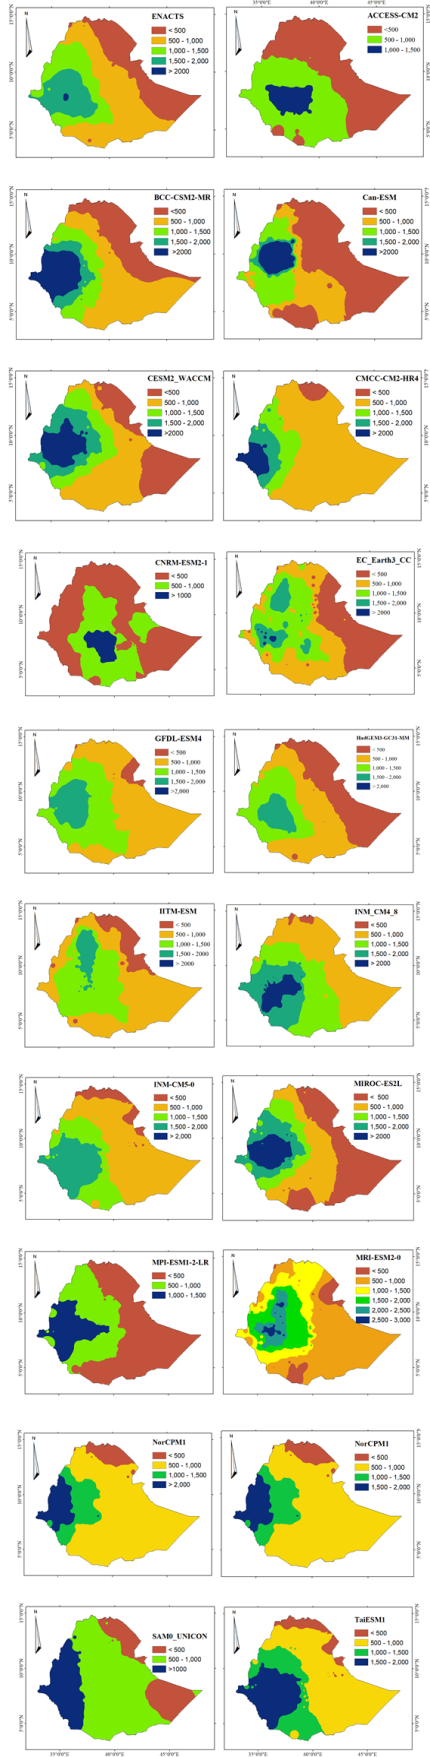
Figure 6. Annual rainfall spatial distribution of ENACTS and CMIP6 climate model over Ethiopia.
Ethiopia's annual rainfall distribution varies greatly by location, with the central and western areas experiencing the most precipitation. The central, northwestern, and southern regions—particularly the central western parts—receive more than 1000 mm of precipitation every year. This study finds that the ENACTS dataset and the majority of CMIP6 models accurately depict the observed rainfall patterns throughout Ethiopia. Nonetheless, there are still differences in the projections of total rainfall even while the models correctly depict the high amounts of precipitation in the west and northwest as well as the lower levels in the southeastern and southern lowlands. Nevertheless, there are still differences in the projections of total rainfall even while the models correctly depict the high amounts of precipitation in the west and northwest as well as the lower levels in the southeastern and southern lowlands.
Previous investigations have revealed similar results. Because to orographic effects and the influence of the Intertropical Convergence Zone (ITCZ), Ethiopia's highland regions—especially those in the west and northwest—receive the highest rainfall, according to also highlighted the sharp contrast between the drier southern lowlands, where rainfall is much lower due to less monsoonal penetration, and the wetter highlands.
Six CMIP6 models (ACCESS-ESM1-5, CanESM5, CNRM-ESM2-1, MPI-ESM1-2-LR, NorCPM1, and SAM0_UNICON) have a tendency to underestimate the 34-year annual average rainfall when compared to the ENACTS dataset. This is consistent with studies by , which showed that Ethiopia's total precipitation is frequently underestimated by global climate models, such as CMIP5 and CMIP6 simulations, especially in areas with heavy rainfall. These disparities are further demonstrated by the regional rainfall distribution seen in Figure 5 and Figure 6.
Furthermore, the majority of Ethiopia's eastern and some southern regions receive less than 500 mm of rainfall each year, based on the ENACTS dataset. This pattern is also shown in other precipitation datasets like CHIRPS and GPCC . According to , global models frequently fail to capture the complex topographical influences on precipitation in Ethiopia. Similarly, some CMIP6 models, such as CMCC-CM2-HR4, MIROC-ES2L, and NorESM2, show lower rainfall estimates in these regions.
Overall, this study highlights the ongoing difficulties in accurately modelling precipitation using CMIP6 datasets while confirming earlier research findings on Ethiopia's rainfall distribution. In order to improve climate estimates for the area, the observed biases point to the necessity for more model resolution and parameterization improvements.
The accuracy of the models in capturing ENACTS monthly mean patterns was assessed using a Taylor diagram. IITM-ESM, CNRM-ESM2-1, ACCESS-CM2, NorCPM1, CMCC-CM2-HR4, and CMCC-CM2_SR5 exhibited significantly higher variability than the reference pattern throughout the study period, while other variables showed minimal spatial variation (Figure 7). Spatial correlations across all models ranged from 0.6 to 0.9, indicating a moderate to strong agreement with observations. Notably, most models demonstrated superior performance in reproducing annual rainfall patterns (Figure 7).
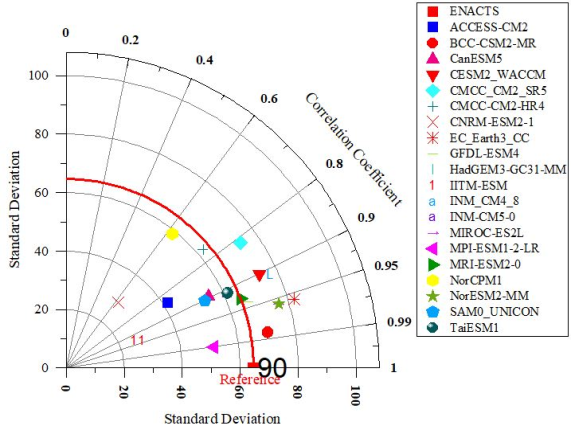
Figure 7. Taylor diagram of mean monthly rainfall over Ethiopia from 1981-2014.
4. Conclusion and Recommendation
This study contrasted the ability of 20 CMIP6 global climate models to simulate the Ethiopian rainfall patterns for the years 1981-2014. The models were contrasted with the high-resolution ENACTS gridded dataset using statistical indices such as the correlation coefficient (CC), root mean square error (RMSE), and percent bias (PBIAS). The findings indicated that while most of the CMIP6 models successfully simulated Ethiopia's rainfall climatology, there existed large variations in model accuracy. Some models exhibited systematic overestimation or underestimation, hence the importance of careful model selection in climate impact assessments.
These models are best suited for climate projections in Ethiopia since they showed the strongest association with rainfall observations: MPI-ESM1-2-LR, BCC-CSM2-MR, MIROC-ES2L, NorESM2-MM, and EC_Earth3_CC. Biases and errors exhibited by some models, however, indicate the necessity of bias correction techniques before utilizing them in future climate estimations.
The results of this study provide critical information to climate model developers, researchers, and policymakers involved in climate adaptation and water resource planning. It is recommended that future research be conducted to further refine model selection criteria and examine regional variations in model performance. Future research must also focus on downscaling approaches to enhance the credibility of climate projections at higher spatial resolutions.
Abbreviations

ENACTS

Enhancing National Climate Services

GCMs

Global Climate Models

CMIP5/6

Coupled Model Intercomparison Project Phase Five/Six

EMI

Ethiopian Meteorology Institute

CHIRPS

Climate Hazards Group InfraRed Precipitation with Station Data

GPCC

Global Precipitation Climatology Centre

Acknowledgments
We would like to extend our sincere gratitude to the Ethiopian Meteorology Institute (EMI); Meteorological data and climatology lead executive office of data delivery and disseminated team for providing with very valuable high resolution gridded ENACTS meteorological rainfall data to conduct this research study.
Author Contributions
Elias Fiseha Mekonnen: Conceptualization, Data curation, Formal Analysis, Investigation, Methodology, Resources, Software, Supervision, Validation, Visualization, Writing - original draft, Writing - review & editing
Endalamaw Wende Wasihun: Data curation, Formal Analysis, Methodology, Resources
Data Availability Statement
ENACTS data used in this study will be acquired from the Ethiopian Meteorology Institute with request due to data policy, and climate model data is included in the publication and can be made available to readers upon request by contacting the corresponding Author.
Funding
The authors declare that no funds or other supports were received during the preparation of this manuscript.
Conflicts of Interest
The authors declare no conflicts of interest.
References
[1] D. Tadesse, “The impact of climate change in Africa,” Inst. Secur. Stud. Ser., vol. 220, no. November, p. 20, 2010, Available:
[2] B. Ayugi et al., “Comparison of CMIP6 and CMIP5 models in simulating mean and extreme precipitation over East Africa,” Int. J. Climatol., vol. 41, no. 15, pp. 6474-6496, 2021.
[3] V. Ongoma and H. Chen, “Temporal and spatial variability of temperature and precipitation over East Africa from 1951 to 2010,” Meteorol. Atmos. Phys., vol. 129, pp. 131-144, 2017.
[4] R. McSweeney and Z. Hausfather, “Q&A: How do climate models work?,” Carbon Br., vol. 15, 2018.
[5] R. L. Wilby, “Evaluating climate model outputs for hydrological applications,” Hydrol. Sci. Journal-Journal des Sci. Hydrol., vol. 55, no. 7, pp. 1090-1093, 2010.
[6] A. F. Lutz, H. W. ter Maat, H. Biemans, A. B. Shrestha, P. Wester, and W. W. Immerzeel, “Selecting representative climate models for climate change impact studies: an advanced envelope-based selection approach,” Int. J. Climatol., vol. 36, no. 12, pp. 3988-4005, 2016,
[7] X. Fan, Q. Duan, C. Shen, Y. Wu, and C. Xing, “Evaluation of historical CMIP6 model simulations and future projections of temperature over the Pan-Third Pole region,” Environ. Sci. Pollut. Res., vol. 29, no. 18, pp. 26214-26229, 2022,
[8] T. H. Alemseged and R. Tom, “Evaluation of regional climate model simulations of rainfall over the Upper Blue Nile basin,” Atmos. Res., vol. 161-162, pp. 57-64, 2015,
[9] A. E. Amognehegn, A. B. Nigussie, D. W. Ayalew, F. F. Abera, and M. Ayana, “Evaluating climate change impact on the hydrology of Kessie Watershed, Upper Blue Nile Basin, Ethiopia,” Appl. Water Sci., vol. 13, no. 7, pp. 1-20, 2023,
[10] B. T. Yersaw, M. B. Chane, and N. A. Yitayew, “Performance evaluation of varies climate models using observed and regional climate models for the Katar Watershed, Ethiopia,” Environ. Syst. Res., vol. 13, no. 1, 2024,
[11] S. Illangasingha, T. Koike, M. Rasmy, K. Tamakawa, H. Matsuki, and H. Selvarajah, “A holistic approach for using global climate model (GCM) outputs in decision making,” J. Hydrol., vol. 626, no. PB, p. 130213, 2023,
[12] E. K. Siabi et al., “Assessment of Shared Socioeconomic Pathway (SSP) climate scenarios and its impacts on the Greater Accra region,” Urban Clim., vol. 49, 2023,
[13] S. Kim et al., “PubChem 2023 update,” Nucleic Acids Res., vol. 51, no. D1, pp. D1373-D1380, 2023,
[14] A. Dosio et al., “Projected future daily characteristics of African precipitation based on global (CMIP5, CMIP6) and regional (CORDEX, CORDEX-CORE) climate models,” Clim. Dyn., vol. 57, no. 11-12, pp. 3135-3158, 2021,
[15] S. Giorgi, M. Lavagna, K. Wang, M. Osmani, G. Liu, and A. Campioli, “Drivers and barriers towards circular economy in the building sector: Stakeholder interviews and analysis of five european countries policies and practices,” J. Clean. Prod., vol. 336, no. January, 2022,
[16] J. Lohmann, D. Castellana, P. D. Ditlevsen, and H. A. Dijkstra, “Abrupt climate change as a rate-dependent cascading tipping point,” Earth Syst. Dyn., vol. 12, no. 3, pp. 819-835, 2021,
[17] S. H. Gebrechorkos, M. T. Taye, B. Birhanu, D. Solomon, and T. Demissie, “Future Changes in Climate and Hydroclimate Extremes in East Africa,” Earth’s Futur., vol. 11, no. 2, pp. 1-21, 2023,
[18] P. O. Omay, N. J. Muthama, C. Oludhe, J. M. Kinama, G. Artan, and Z. Atheru, “Evaluation of CMIP6 historical simulations over IGAD region of Eastern Africa,” Discov. Environ., vol. 1, no. 1, 2023,
[19] S. Pradhananga, A. Lutz, A. Shrestha, I. Kadel, B. Nepal, and S. Nepal, “Selection and downscaling of general circulation model datasets and extreme climate indices analysis,” Int. Cent. Integr. Mt. Dev., 2020.
[20] D. Fenta Mekonnen and M. Disse, “Analyzing the future climate change of Upper Blue Nile River basin using statistical downscaling techniques,” Hydrol. Earth Syst. Sci., vol. 22, no. 4, pp. 2391-2408, 2018.
[21] Z. T. Segele, M. Leslie, and P. J. Lamb, “Evaluation and adaptation of a regional climate model for the Horn of Africa : rainfall climatology and interannual,” no. August 2024, 2009,
[22] C. Funk et al., “The climate hazards infrared precipitation with stations - A new environmental record for monitoring extremes,” Sci. Data, vol. 2, pp. 1-21, 2015,
[23] E. Viste, D. Korecha, and A. Sorteberg, “Recent drought and precipitation tendencies in Ethiopia,” Theor. Appl. Climatol., vol. 112, no. 3-4, pp. 535-551, 2013,
[24] S. H. Gebrechorkos, S. Hülsmann, and C. Bernhofer, “Regional climate projections for impact assessment studies in East Africa,” Environ. Res. Lett., vol. 14, no. 4, 2019,
[25] S. Alemayehu, D. Olago, O. Alfred, T. T. Zeleke, and S. W. Dejene, “Spatiotemporal analysis of rainfall and temperature variability and trends for a mixed crop-livestock production system: its implications for developing adaptation strategies,” Int. J. Clim. Chang. Strateg. Manag., pp. 268-290, 2024,
Cite This Article
  • APA Style

    Mekonnen, E. F., Wasihun, E. W. (2025). Evaluation of Coupled Model Intercomparison Project Phase 6 (CMIP6) Model Capability to Predict Rainfall over Ethiopia. International Journal of Atmospheric and Oceanic Sciences, 9(2), 99-111. https://doi.org/10.11648/j.ijaos.20250902.13

    Copy | Download

    ACS Style

    Mekonnen, E. F.; Wasihun, E. W. Evaluation of Coupled Model Intercomparison Project Phase 6 (CMIP6) Model Capability to Predict Rainfall over Ethiopia. Int. J. Atmos. Oceanic Sci. 2025, 9(2), 99-111. doi: 10.11648/j.ijaos.20250902.13

    Copy | Download

    AMA Style

    Mekonnen EF, Wasihun EW. Evaluation of Coupled Model Intercomparison Project Phase 6 (CMIP6) Model Capability to Predict Rainfall over Ethiopia. Int J Atmos Oceanic Sci. 2025;9(2):99-111. doi: 10.11648/j.ijaos.20250902.13

    Copy | Download

  • @article{10.11648/j.ijaos.20250902.13,
      author = {Elias Fiseha Mekonnen and Endalamaw Wende Wasihun},
      title = {Evaluation of Coupled Model Intercomparison Project Phase 6 (CMIP6) Model Capability to Predict Rainfall over Ethiopia
    },
      journal = {International Journal of Atmospheric and Oceanic Sciences},
      volume = {9},
      number = {2},
      pages = {99-111},
      doi = {10.11648/j.ijaos.20250902.13},
      url = {https://doi.org/10.11648/j.ijaos.20250902.13},
      eprint = {https://article.sciencepublishinggroup.com/pdf/10.11648.j.ijaos.20250902.13},
      abstract = {There is a need for accurate climate model simulations to understand climate change and its socioeconomic implications. The main objective of this study was to evaluate the performance of twenty global climate models from Coupled Model Intercomparison Project Phase 6 (CMIP6) over Ethiopia. Enhancing National Climate Services (ENACTS) and Climate models rainfall data from 1981 to 2014 were utilized for model performance evaluation in this study. The performances of the models were evaluated with statistical metrics of Correlation Coefficient (CC), Root Mean Square Error (RMSE), and Percent Bias (PBIAS). The findings of this study indicated that most models had similar trends with the ENACTS. Among twenty climate models, six models such as ACCESS-ESM1-5, CanESM5, CNRM-ESM2-1, MPI-ESM1-2-LR, NorCPM1, and SAM0_UNICON underestimated the rainfall. Based on the statistical metrics values of correlation coefficient (CC), MPI-ESM1-2-LR (0.99), BCC-CSM2-MR (0.98), MIROC-ES2L (0.96), NorESM2-MM (0.96), and EC_Earth3_CC (0.96) are best performing models. For all models but IITM-ESM and MRI-ESM2-0, RMSE values were below 5 mm and PBIAS values were within a desirable range (-3.94 to 4.3). These results underscore the importance of selecting appropriate models for evaluating climate impacts, particularly for extreme rainfall events over Ethiopia.},
     year = {2025}
    }
    

    Copy | Download

  • TY  - JOUR
    T1  - Evaluation of Coupled Model Intercomparison Project Phase 6 (CMIP6) Model Capability to Predict Rainfall over Ethiopia
    
    AU  - Elias Fiseha Mekonnen
    AU  - Endalamaw Wende Wasihun
    Y1  - 2025/08/13
    PY  - 2025
    N1  - https://doi.org/10.11648/j.ijaos.20250902.13
    DO  - 10.11648/j.ijaos.20250902.13
    T2  - International Journal of Atmospheric and Oceanic Sciences
    JF  - International Journal of Atmospheric and Oceanic Sciences
    JO  - International Journal of Atmospheric and Oceanic Sciences
    SP  - 99
    EP  - 111
    PB  - Science Publishing Group
    SN  - 2640-1150
    UR  - https://doi.org/10.11648/j.ijaos.20250902.13
    AB  - There is a need for accurate climate model simulations to understand climate change and its socioeconomic implications. The main objective of this study was to evaluate the performance of twenty global climate models from Coupled Model Intercomparison Project Phase 6 (CMIP6) over Ethiopia. Enhancing National Climate Services (ENACTS) and Climate models rainfall data from 1981 to 2014 were utilized for model performance evaluation in this study. The performances of the models were evaluated with statistical metrics of Correlation Coefficient (CC), Root Mean Square Error (RMSE), and Percent Bias (PBIAS). The findings of this study indicated that most models had similar trends with the ENACTS. Among twenty climate models, six models such as ACCESS-ESM1-5, CanESM5, CNRM-ESM2-1, MPI-ESM1-2-LR, NorCPM1, and SAM0_UNICON underestimated the rainfall. Based on the statistical metrics values of correlation coefficient (CC), MPI-ESM1-2-LR (0.99), BCC-CSM2-MR (0.98), MIROC-ES2L (0.96), NorESM2-MM (0.96), and EC_Earth3_CC (0.96) are best performing models. For all models but IITM-ESM and MRI-ESM2-0, RMSE values were below 5 mm and PBIAS values were within a desirable range (-3.94 to 4.3). These results underscore the importance of selecting appropriate models for evaluating climate impacts, particularly for extreme rainfall events over Ethiopia.
    VL  - 9
    IS  - 2
    ER  - 

    Copy | Download

Author Information