Research Article | | Peer-Reviewed

Assessment of Household Livelihood Vulnerability to Flood Risks Among the Livestock Farmers in Kilosa District, Morogoro-Tanzania

Received: 20 July 2026     Accepted: 14 August 2026     Published: 9 September 2026
Views:       Downloads:
Abstract

Flood risk is a challenge extending physical exposure to encompass household livelihood vulnerability. This study explored livestock farmers’ household livelihood vulnerability to flood risk in Kilosa District, Morogoro, Tanzania. Using the Livelihood Vulnerability Framework (LVI-IPCC), the study highlighted social-demographic profile, livelihood strategies, social networks, health, food, water, natural disasters and climate variability, and flood coping and adaptation capacity as the key contributors to livestock farmers’ household livelihood vulnerability to flood risk. The questionnaires and interview methods were used to collect data from 138 respondents. The data were processed using SPSS Version 20, with descriptive and Livelihood Vulnerability Framework (LVI-IPCC) approaches. The findings highlighted uniform exposure of the study wards to flooding impacts, whereby the overall LVI-IPCC (0.431) indicated moderately to highly household livelihood vulnerability to flood risk. Despite these challenges, communities demonstrated resilience through relocation of livestock (35.5%), using savings (33.3%), selling livestock to cover costs (65.9%), and borrowing (13.8%). Diversification into alternative income-generating activities such as crop farming and trading was prevalent. Weak infrastructure and support systems hindered long-term resilience. Since local adaptive approaches provided essential short-term relief, there is a need for integrated policy interventions to enhance adaptive capacity. Addressing household livelihood vulnerability provides a comprehensive understanding for building sustainable livestock-based livelihoods in the face of increasing climate change and variability.

Published in International Journal of Environmental Protection and Policy (Volume 14, Issue 5)
DOI 10.11648/j.ijepp.20261405.11
Page(s) 105-117
Creative Commons

This is an Open Access article, distributed under the terms of the Creative Commons Attribution 4.0 International License (http://creativecommons.org/licenses/by/4.0/), which permits unrestricted use, distribution and reproduction in any medium or format, provided the original work is properly cited.

Copyright

Copyright © The Author(s), 2026. Published by Science Publishing Group

Keywords

Flood Risks, Adaptive Capacity, Rural Livelihoods, Vulnerability, Resilience, Climate Change

1. Introduction
Flooding refers to water overflow onto an area that is usually dry and not typically associated with a water body . Floods can result from heavy rainfall, poor land use planning, inadequate drainage, human activities, and living on gently sloping terrain . The frequency, intensity, and effects of floods are steadily increasing as a result of global warming .
Frequent and intense floods threaten the physical environment, destroy infrastructure, cause loss of livestock, and disrupt communities’ social fabric, leading to member displacement, property loss, outbreaks of human diseases, essential services deterioration, and increased household livelihood vulnerabilities among community members .
Rising exposure and limited adaptation will increase the occurrence of flood hazards, causing material losses and deaths . It is essential to assess the historical effects of flooding and monitor its current hazards .
An effective flood response is important in preventing psychological impacts, disease outbreaks, and deaths. Hence, various strategies, initiatives, and measures are needed for successful responses .
Destruction of wetlands and forests weakens flood defenses, increasing the risk of disaster; hence, communities should preserve them for flood preparation . As climate change intensifies, the oldest and poorest from poor countries are more vulnerable due to the absence of flood preparation .
Vulnerability is an initial condition present in a system before facing the hazardous event due to environmental shocks such as flooding. Hence, it is the construct shaped by societies through institutional and economic changes. Societies with similar characteristics of socio-economic and different environmental attributes can be vulnerable at varying levels .
LVI-IPCC provides a quantitative and comprehensive vulnerability measure by integrating multiple environmental and socio-economic indicators into exposure, sensitivity, and adaptive capacity. It is suitable since it captures the multi-dimensional nature of livelihoods, including social demographic profile, health, livelihood strategies, water access, exposure to natural hazards, food security, social networks, and flood coping and adaptation capacity. Furthermore, it allows spatial unit comparison, such as wards, which enables identifying higher vulnerable areas to inform adaptation intervention .
Exposure is the extent to which the system is subjected to hazards. Sensitivity shows the degree to which the system is affected when exposed to hazards, while the adaptive capacity represents the household’s capacity to cope with, anticipate, and recover from climate shocks .
Apart from LVI-IPCC, other frameworks like DFID Sustainable Livelihood Framework (SLF) introduced the five livelihood capitals, which determine the ability of the households to cope with climate shocks and sustain their livelihoods. Human capital refers to knowledge, skills, labor capacity, and education, which influence productivity and decision-making. Social capital refers to institutional relationships and social networks facilitating support and information access. Natural capital represents the natural resources, such as grazing land, pasture, and water, which support the production of livestock. Physical capital comprises productive assets and infrastructure such as roads, livestock shelters, and veterinary services. Financial capital represents monetary resources such as savings, household income, livestock assets, and credit. These capitals are collectively determinant of the adaptive capacity and resilience of the households facing climate shocks like flooding .
Flooding adversely impacts all five livelihood capitals and underpins rural livelihoods. The cumulative impacts reduce the adaptive capacity of the households and increase the sensitivity, leading to higher LVI-IPCC vulnerability to flooding events and higher losses in livestock farming .
Livestock has a central role in sustaining household livelihoods of the people in Kilosa District. It is vital for a household’s income, food security, and employment . Therefore, the effects of flooding extend more deeply, generating household consequences. A clear understanding of household livelihood vulnerability is needed for designing effective and context-specific efforts for disaster reduction . This study seeks to fill the gap by investigating the household livelihood vulnerability to flood risk for livestock farming communities in Kilosa District. Moreover, local adaptive approaches are often rooted in traditional knowledge and social networks; hence, they are not well documented, making it difficult for policymakers and development practitioners to design effective, context-specific resilience strategies. This study is therefore justified in its aim to bridge this knowledge gap by assessing household livelihood vulnerability to flood risk among affected livestock farmers in Kilosa District, ultimately contributing to more informed and sustainable disaster management interventions .
This study is significant as its findings are relevant for policymakers, local authorities, development practitioners, and researchers aiming to support vulnerable communities through inclusive, locally grounded adaptive strategies. The study’s outcomes can guide the formulation of more inclusive, community-centered adaptation policies that strengthen resilience among livestock farmers. Furthermore, the research contributes to a broader academic understanding of how environmental shocks intersect with livelihood systems, offering a valuable reference for comparative studies in similar pastoral and agro-pastoral settings across sub-Saharan Africa.
2. Materials and Methods
2.1. Study area
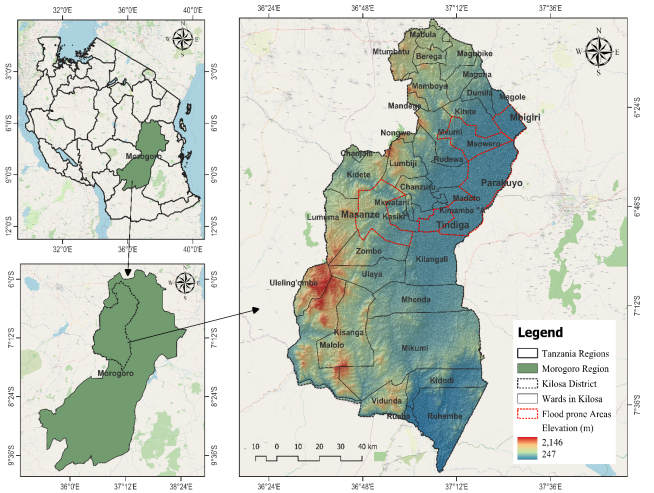
The survey was conducted in Mvumi, Msowero, Madoto, Parakuyo, Tindiga, and Mbigiri wards in Kilosa District in Morogoro region, Tanzania. Kilosa District is among the oldest in Tanzania and it was established in 1926 . The district is located between the longitudes of 360 30’ and 370 3’ East and latitude 50 55’ and 70 53’ South. Its total area is about 12 393.7 km2 and it occupies about 17% of the total land area in Morogoro region. It is bordered by Mvomero to the East, Kilombero and Iringa to the south, Gairo and Mpwapwa to the west, and Gairo to the North . It gets extended season of rainy for eight months, with its peak between February and March. In wet years, the rainfall exhibits binomial pattern, with long rains between mid-February and May, while brief rains occur from October to January. The average annual rainfall in the district is 100 to 1 400 mm, and average temperature is 25°C . It has a population of about 617 032 people, where 308 828 are females and 308 204 are males. It has 165 789 households, with an average household size of 3.7 people and a sex ratio of 100 .
Figure 1. Study area Map. Kilosa District, Morogoro, Tanzania Tanzania.
2.2. Data Collection
The data were collected between August and September 2025 in Kilosa District Morogoro Tanzania. Field survey questionnaires and interviews were used to collect data from 138 livestock farmers operating in flood-prone areas affected by floods during 2023/2024. The study focused on participants whose livelihoods are primarily or largely constituted by livestock farming, including the rearing of cattle, goats, sheep, and pigs. Additionally, it encompassed males and females of diverse ages and socio-economic backgrounds within the study area.
2.2.1. Research Design
This study used a cross-sectional research approach to collect data from the respondents. A cross-sectional design allows variable relationship analysis for data collected at once and generates meaningful and efficient insight for decision-making . Based on the objectives of the study, a cross-sectional research design was appropriate and sufficient to provide the required information.
2.2.2. Sample Size Determination
The sample size was estimated using Cochran's formula for an unknown population by assuming the level of confidence of 95% (Z = 1.96) with the precision error of 0.05 and 10% (p=0.1) variability.
Sample size=Z2.p.qe2(1)
Where:
Z= Z-Score to desired level of confidence
p=Estimated population proportion processing interest characteristics
q=1-p
e=Desired precision level (5%)
The livestock farmers’ population exposed to flood risk was unknown during sampling. Hence, the Cochran formula became appropriate for estimating the minimum size of a sample of an unknown population. Due to the absence of empirical local data for the study area, p was set to 0.1 to reflect the expectation that a relatively small population of livestock farmers was vulnerable to flood hazards within Kilosa District.
2.2.3. Sampling Procedures
Purposive sampling was used to select villages with active livestock farming activities; then, by using a stratified sampling technique, the strata were constructed in each ward by considering the key characteristics of the respondents, for example, geographical characteristics, to ensure adequate representativeness , while the individual representatives in each ward were selected using a simple random sampling method.
2.3. Components and Indicators
Table 1. LVI-IPCC contributing factors, major components, indicators, and livelihood Capitals.

Major components

Indicators

Contributing Factors

Livelihood capital

Natural Disasters and Climate Variability (NDCV)

Flood effects on farms and households

Exposure

Vulnerability context

Main causes of floods

Exposure

Vulnerability context

Location of the farm near flood-prone area

Exposure

Natural capital

Food Security (FS)

Food shortages

Sensitivity

Human capital

Food aid

Sensitivity

Social capital

Health (H)

Human diseases outbreak

Sensitivity

Human capital

Livestock diseases outbreak

Sensitivity

Financial capital

Delayed access to veterinary care or animal medicine

Sensitivity

Human capital

Water (W)

Loss of clean drinking water

Sensitivity

Natural capital

Limited access to water source

Sensitivity

Natural capital

Livelihood strategies (LS)

Loss of livelihood (decrease in income)

Sensitivity

Financial capital

Loss of livestock

Sensitivity

Financial capital

Dependency on livestock as primary source

Sensitivity

Financial capital

Social Demographic Profile (SDP)

Age

Adaptive capacity

Human capital

Gender

Adaptive capacity

Human capital

Education

Adaptive capacity

Human capital

Household size

Adaptive capacity

Human capital

Marital status

Adaptive capacity

Human capital

Duration in livestock farming

Adaptive capacity

Human capital

Duration of living in the community

Adaptive capacity

Social capital

Social Networks (SN)

Change in social cohesion

Adaptive capacity

Social capital

Change in community participation

Adaptive capacity

Social capital

Increase in migration

Adaptive capacity

Social capital

Support system availability

Adaptive capacity

Social capital

Flood coping and adaptation capacity (FCAC)

Flood protection measures

Adaptive capacity

Physical capital

Using savings

Adaptive capacity

Financial capital

Borrowing

Adaptive capacity

Financial capital

Selling livestock to cover cost

Adaptive capacity

Financial capital

Relocation of livestock

Adaptive capacity

Physical capital

Limited financial resources to recover from flood

Adaptive capacity

Financial capital

Limited access to flood resistant infrastructure

Adaptive capacity

Physical capital

Lack of information and education on flood risk management

Adaptive capacity

Human capital

Source: Field work
The LVI-IPCC framework investigates the vulnerability of the livelihood through socio-demographic profile, social networks, livelihood strategies, water, food, health, and natural disasters and climate variability. This does not evaluate households’ capacity to practice measures for flood protection and adaptation. The flood coping and adaptation capacity has been included due to the nature of the study as an additional major component and is justified, as it measures the capacity of households to minimize flood effects before, during, and after flooding. Furthermore, it provides information on the resilience of the households to flood events. Referring to the Intergovernmental Panel on Climate Change (IPCC), livelihood vulnerability was defined as a composite function of sensitivity, exposure, and adaptive capacity. Flood coping and adaptation capacity are crucial determinants of adaptive capacity as they influence the extent to which households can cope with, resist, anticipate, and recover from hazards due to floods. Effective adaptation mechanisms and flood protection measures make the households less vulnerable. Climate change adaptation studies emphasize the assessment of livelihood vulnerability that should align with local environmental conditions and characteristics of the hazards . In this study, the objective is to investigate the social effects and livestock farmers’ household livelihood vulnerability to flood risk; hence, incorporating a specific component of flood hazard adaptation improves the analysis accuracy and sensitivity through capturing the resilience dimensions, which otherwise would remain unmeasured. The flood coping and adaptation capacity major components additionally strengthen the LVI-IPCC framework and provide a comprehensive investigation of livestock farmers’ household livelihood vulnerability to flood risk, enhancing the relevance by identifying households that are vulnerable and informing interventions for flood risk adaptation and reduction. Moreover, the livelihood indicators have been linked to DFID livelihood capitals. In this study, the LVI-IPCC has been used as the analytical framework, and the DFID Sustainable Livelihood Framework (SLF) has been used as a theoretical lens for interpreting the LVI-IPCC vulnerability results. The adaptive capacity, in particular, is largely determined by livelihood capital; hence, showing the relationship between LVI-IPCC indicators and livelihood capital strengthens the theoretical foundation of the study.
2.4. Data Analysis
The Livelihood Vulnerability Framework (LVI-IPCC) approach was employed to analyze the data. The Livelihood Vulnerability Index-IPCC (LVI-IPCC) is a framework used to assess livelihood vulnerability to climate change, as clarified by Hahn . The assessment is conducted by organizing livelihood indicators into the three vulnerability dimensions defined by the Intergovernmental Panel on Climate Change: exposure (E), sensitivity (S), and adaptive Capacity (AC) .
For the Livelihood Vulnerability Index (LVI-IPCC) which in this context, focused on flood livelihood vulnerability of livestock farmers’ households, the indicators were organized into the standard Livelihood Vulnerability Index (LVI) major components and then linked to the three IPCC contributing factors mentioned above, which are exposure, sensitivity, and adaptive Capacity.
To facilitate the analysis, eight (8) major components and thirty-two (32) indicators were selected for the Livelihood Vulnerability Index (LVI-IPCC) analysis. The selected indicators cover the major components in terms of the socio-demographic characteristics, livelihood strategies, social networks, health, food security, water access, natural disasters and climate variability, and flood coping and adaptation capacity. The indicators were adapted to fit the local context and the study objectives .
The indicators were measured in different units; hence, each indicator was standardized. The standardization was done according to the Human Development Index (HDI) as clarified by Hahn . The standardization process allowed comparison and aggregation across variables , and it referred to the following equation;
Index i = Sv - SminSmax - Smin(2)
Where:
Sv = Observed or actual value of each indicator
Smin = Minimum value for each indicator,
Smax = Maximum value for each indicator
Index i = Standardized indicator index
In addition, the related indicators were grouped into major components. The standardized indicators within each major component were averaged to obtain a major component score by using the following equation;
Md = i=1nindex in(3)
Where:
Md =Major component index
n =Total number of indicators in the major component
The overall LVI means the weighted average of all major components . It is calculated using the following equation;
LVI=i=1nWiMii=1nWi(4)
Where:
Mi= Value of major component indexi
Wi= Weight (number of indicators) assigned to componenti
n = Total number of major components
According to Hahn , the LVI and LVI-IPCC are determined by similar indicators. Hence, the standardized indicators were reorganized into exposure, sensitivity, and adaptive capacity, and IPCC contributing factors were calculated. The following formula was used;
CFd=i=1nWmiMdii=1nWmi(5)
Where:
CFd=Exposure, Sensitivity, or Adaptive Capacity
Wmi=Number of indicators in each major component
n=number of major components in that contributing factor
Mdi=Value of major componenti (major component index)
The final IPCC Livelihood Vulnerability Index (LVI-IPCC) was calculated as;
(LVI-IPCC)=(E-A) X S(6)
Where: E=Exposure A=Adaptive Capacity S=Sensitivity
The LVI-IPCC result ranges from -1 (least vulnerable) to 1 (Highly vulnerable)
3. Results
3.1. Social Demographic Profiles and Farming Characteristics of the Respondents
Table 2. Socio-demographic profile and farming characteristics of the respondents.

Variable

Category

Frequency

Percent

Age group (years)

18-25

9

6.5

26-35

30

21.7

36-45

26

18.8

46-60

52

37.7

Above 60

21

15.2

Gender

Male

123

89.1

Female

15

10.9

Marital status

Single

3

2.2

Married

128

92.8

Widowed

4

2.9

Divorced

3

2.2

Educational level

No formal education

49

35.5

Primary education

74

53.6

Secondary education

9

6.5

College/University education

6

4.3

Household size

1-3

8

5.8

4-6

37

26.8

7-10

42

30.4

Above 10

51

37.0

Duration of living in the community (years)

3-5

11

8.0

6-10

9

6.5

Above10

118

85.5

Duration of involvement in livestock farming (years)

3-5

22

15.9

6-10

8

5.8

Above 10

108

78.3

Total number of livestock owned before the floods

1-50

63

45.7

51-100

25

18.1

101-200

27

19.6

201-300

12

8.7

301-400

5

3.6

Above 400

6

4.3

Number of cattle owned before the floods

1-50

79

57.2

51-100

25

18.1

101-200

17

12.3

201-300

4

2.9

301-400

1

0.7

Not owned

12

8.7

Types of cattle owned

Beef cattle (Meat production)

7

5.1

Beef and dairy cattle

119

86.2

Not owned

12

8.7

Number of goats owned before the floods

1-50

78

56.5

51-100

19

13.8

101-200

7

5.1

301-400

1

0.7

Not owned

33

23.9

Number of sheep owned before the floods

1-50

72

52.2

51-100

9

6.5

101-200

3

2.2

Not owned

54

39.1

Number of pigs owned before the floods

1-50

12

8.7

Not owned

126

91.3

Source: Field work
Table 2 represents the socio-demographic profile of the respondents. The majority (89.1%) were male, while 10.9% were female. This reflects gender norms in livestock ownership within the study area. Most respondents (37.7%) were aged between 46 and 60 years. The majority (53.6%) attained a primary education, while college or university education was attained by only 4.3%. Most households (37%) comprised more than 10 members. Furthermore, 78.3% had more than 10 years of experience in livestock farming, indicating substantial skills and knowledge in livestock production and flood challenges.
3.2. Standardized Indicators
Table 3. Standardized Indicator values by ward.

Indicators

Mvumi

Msowero

Madoto

Parakuyo

Tindiga

Mbigiri

Flood effects on farms and households (NDCV1)

1.00

1.00

1.00

1.00

1.00

1.00

Main causes of floods (NDCV2)

1.00

1.00

1.00

1.00

1.00

1.00

Location of farm near flood-prone area (NDCV3)

1.00

1.00

1.00

1.00

1.00

1.00

Food shortages (FS1)

1.00

1.00

1.00

1.00

1.00

1.00

Food aid (FS2)

0.03

0.00

0.00

0.00

0.00

0.00

Human diseases Outbreak (H1)

0.27

0.195

0.15

0.188

0.47

0.5

Livestock diseases outbreak (H2)

0.9

0.93

0.95

1.00

1.00

1.00

Delayed access to veterinary care or animal medicine (H3)

1.00

1.00

1.00

1.00

1.00

1.00

Loss of clean drinking Water (W1)

0.83

0.93

0.95

1.00

0.82

0.00

Limited access to water Source (W2)

0.9

0.63

1.00

0.81

0.88

0.00

Loss of livestock (LS1)

0.43

0.61

0.85

0.94

1.00

0.93

Dependency on livestock as primary source (LS2)

0.47

0.54

1.00

1.00

1.00

1.00

Loss of livelihood (decrease in income) (LS3)

0.97

0.98

1.00

1.00

1.00

1.00

Age (SDP1)

0.45

0.47

0.48

0.55

0.299

0.47

Gender (SDP2)

0.033

0.00

0.00

0.88

0.00

0.00

Marital status (SDP3)

0.10

0.00

0.00

0.19

0.06

0.00

Education (SDP4)

0.27

0.195

0.55

0.69

0.41

0.29

Household size (SDP5)

0.296

0.32

0.45

0.42

0.22

0.46

Duration of living in the community (SDP6)

0.31

0.21

0.47

0.55

0.299

0.55

Duration in livestock farming (SDP7)

0.19

0.23

0.45

0.49

0.35

0.52

Change in social cohesion (SN1)

0.63

0.29

0.25

0.69

0.88

0.57

Change in community participation (SN2)

0.47

0.32

0.3

0.75

0.82

0.57

Increase in migration (SN3)

0.65

0.34

0.35

0.25

1.00

0.07

Support system Availability (SN4)

0.00

0.17

0.35

1.00

0.00

0.00

Flood protection measures (Presence of at least one flood protection structure) (FCAC1)

0.17

0.07

0.00

0.00

0.06

0.14

Using savings (FCAC2)

0.27

0.44

0.1

0.38

0.35

0.43

Borrowing (FCAC3)

0.07

0.12

0.25

0.88

0.18

0.07

Selling livestock to cover costs (FCAC4)

0.43

0.56

0.8

0.69

0.88

0.93

Relocation of livestock (FCAC5)

0.13

0.37

0.35

0.19

0.88

0.36

Limited financial resources to recover from flood (FCAC6)

0.4

0.61

0.85

0.81

1.00

0.93

Limited access to flood-resistant infrastructure (FCAC7)

0.4

0.56

0.55

0.75

0.88

0.07

Lack of information and education on flood risk management (FCAC8)

0.8

0.27

0.7

0.88

0.88

0.5

Source: Field work
Table 3 shows that the values of the standardized indicators vary across the surveyed wards, reflecting vulnerability variations to flood risk among the livestock-based livelihoods. Higher standardized values reflect greater vulnerability, whereas lower standardized values reflect lower vulnerability.
3.3. Major Component Scores
Table 4. Major component index by ward.

Major component index

Mvumi

Msowero

Madoto

Parakuyo

Tindiga

Mbigiri

Natural Disasters and Climate Variability Index (NDCVI)

1.00

1.00

1.00

1.00

1.00

1.00

Food Security Index (FSI)

0.515

0.5

0.5

0.5

0.5

0.5

Health Index (HI)

0.723

0.708

0.7

0.729

0.823

0.833

Water Index (WI)

0.865

0.78

0.975

0.905

0.85

0.00

Livelihood Strategy Index (LSI)

0.623

0.71

0.95

0.98

1.00

0.977

Socio-Demographic Profile Index (SDPI)

0.236

0.204

0.343

0.539

0.234

0.327

Social Network Index (SNI)

0.438

0.28

0.313

0.673

0.675

0.303

Flood Coping and Adaptation Capacity Index (FCACI)

0.334

0.375

0.45

0.573

0.639

0.429

Source: Field work
The major component score values in Table 4 indicate the variations in vulnerability among the surveyed wards. The values associated with higher component index reflect a higher vulnerability, whereas lower values indicate better conditions and lower livelihood vulnerability.
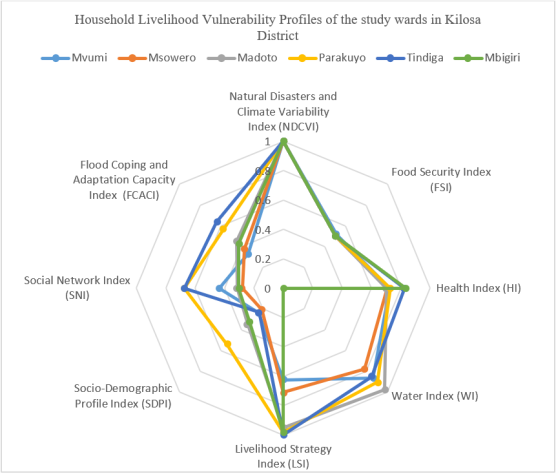
Figure 2. Radar chart showing the Vulnerability component scores of the households to flood risks (Source. Fieldwork).
Figure 2 represents a radar chart which illustrating the livelihood vulnerability major component indices across the surveyed wards. The chart enables visual comparison of relative weaknesses and strengths of each ward in respect to component vulnerability assessed. A greater distance from the center reflects larger index values, and hence, higher livelihood vulnerability, whereas a small distance reflects lower livelihood vulnerability. The chart facilitates components identification, which mostly contribute to livelihood vulnerability in each ward, and highlights vulnerability patterns variations across the surveyed area.
3.4. LVI-IPCC Contributing Factors, Scores, and Ranking
Table 5. LVI-IPCC contributing factors, LVI-IPCC scores and Vulnerability Rank by ward.

Mvumi

Msowero

Madoto

Parakuyo

Tindiga

Mbigiri

Exposure

1.00

1.00

1.00

1.00

1.00

1.00

Sensitivity

0.68

0.681

0.79

0.794

0.817

0.643

Adaptive Capacity

0.320

0.292

0.382

0.582

0.497

0.365

LVI-IPCC scores

0.462

0.482

0.488

0.332

0.411

0.408

Vulnerability Rank

3

2

1

6

4

5

Aggregated LVI-IPCC

0.431

Source: Field work
Table 5 shows the Livelihood Vulnerability Index as per the IPCC framework, whereby the aggregated score of LVI-IPCC in the District was 0.431. Furthermore, it shows the vulnerability rank of each ward. The vulnerability rank is a comparison and communication tool identifying the wards that are relatively less or more vulnerable. The vulnerability rank indicates the relative vulnerability level among the studied wards, based on the magnitude of the LVI-IPCC value. It enables the readers to identify more vulnerable wards quickly and communicate the priority for intervention to policymakers and disaster management agencies. The LVI-IPCC results indicate that the adaptive capacity of the surveyed communities was outweighed by exposure and sensitivity, as suggested by positive LVI-IPCC values across all wards. This makes the surveyed communities more vulnerable to flooding.
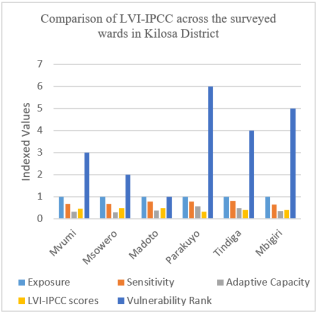
Figure 3. Bar chart showing the comparison of LVI-IPCC across the study wards (Source. Field Work).
Figure 3 represents the LVI-IPCC values comparison across the study wards. It enhances the visual representation of livelihood vulnerability levels to flood risks among the livestock farming community in the study area. Wards with large values of LVI-IPCC are considered to be highly vulnerable, indicating a combination of higher sensitivity and exposure, with low adaptive capacity, whereas wards with low values of LVI-IPCC exhibit low vulnerability.
4. Discussion
The LVI-IPCC highlighted the high exposure of livestock farmers to flood risk across all wards, as indicated by a higher exposure index (E=1.0) in each ward. This shows the occurrence of flooding hazards across the entire study area. Differences in sensitivity and adaptive capacity highly drive differences in livelihood vulnerability among the study wards.
Madoto ward indicated the highest vulnerability index (LVI-IPCC=0.488), suggesting that it was the most vulnerable to flooding compared to others, followed by Msowero (LVI-IPCC=0.482) and Mvumi (LVI-IPCC=0.462). These wards have exhibited higher levels of flooding exposure and sensitivity to household livelihood, which demonstrates weak community adaptive capacity of 0.382, 0.292, and 0.320 for Madoto, Msowero, and Mvumi, respectively. According to the IPCC framework, household vulnerability increases when there is limited or low capacity to cope with, anticipate, and recover from shocks, even when exhibiting similar levels of exposure . According to the DFID Sustainable Livelihood Framework, households’ access to livelihood assets (Social, human, physical, financial, and natural assets) and their capacity to respond to flooding shape the livelihood vulnerability. Hence, variations in vulnerability across wards may indicate differences in the quality and quantity of these livelihood assets . Low adaptive capacity in Madoto, Msowero, and Mvumi wards may imply inadequate access to resources, low opportunities for livelihood diversification, inadequate support services for livestock, and a lack of climate information essential for resilience enhancement to flooding impacts . Furthermore, a relatively higher score of livelihood vulnerability indicates the limited possession of livelihood assets by livestock farming households, with low adaptive capacity while facing higher exposure, and greater sensitivity to flood risk. The DFID Sustainable Livelihood Framework perspective suggests that, when livestock shelters as the physical capital are poorly constructed, and the infrastructure for flood control is insufficient, the flood damage susceptibility may increase. Similarly, when the financial capital, such as credit access, diversification of household income, and savings, is limited, the ability of the households to recover and absorb flood shocks may be constrained. These conditions heightened the livelihood vulnerability . These findings reflect the flood challenges in these wards, from the perspectives of the DFID Sustainable Livelihood Framework, human capital weaknesses, including knowledge for disaster preparedness, livestock management skills, and limited extension services, may reduce the capacity of the households to respond to flood risks effectively. Moreover, when social capital is weak, characterized by limited support networks and community groups’ participation, it may restrict information access and collective flood coping mechanisms during the crisis .
In contrast, Parakuyo ward demonstrated the lowest household vulnerability index (LVI-IPCC=0.332) among others despite its higher sensitivity level (S=0.794); this can be attributed to its comparatively higher adaptive capacity (AC=0.582). This highlights the role of adaptive capacity in minimizing household vulnerability even under high exposure and sensitivity. This corroborates similar vulnerability studies’ observations, which highlighted the critical role of adaptive capacity in reducing the adverse effects under higher exposure and sensitivity . Through the lens of the DIFD Sustainable Livelihood Framework, these results suggest the possession of a strong asset base with higher adaptive capacity. Adequate access to strong social networks, financial resources, enhanced human capital, and improved infrastructure enables households to recover, prepare for, and withstand flood events effectively. Moreover, the low score of vulnerability implies better-suited livelihood strategies to manage flood risks by reducing exposure and sensitivity .
Tindiga and Mbigiri wards have recorded an intermediate level of livelihood vulnerability (LVI-IPCC=0.411 and LVI-IPCC=0.408), respectively, despite their varied levels of sensitivity and adaptive capacities. Tindiga ward has the highest level of sensitivity (S=0.817), indicating high susceptibility of livestock farmers’ households to flood hazards. However, its adaptive capacity is relatively stronger (AC=0.497), moderating the level of overall livelihood vulnerability. Likewise, Mbigiri ward (S=0.643, AC=0.365) has a similar score of livelihood vulnerability due to the balanced characteristics of its sensitivity and adaptive capacity. These findings highlight that the determination of livelihood vulnerability is not solely justified by the magnitude of hazard exposure, but through the interaction between exposure, sensitivity, and adaptive capacity . Furthermore, these wards may have strong livelihood capitals or more efficient adaptation strategies compared to those in more vulnerable study wards .
The overall LVI-IPCC value of 0.431 indicates that the livestock farmers’ household livelihood vulnerability to flood risk in the study area is moderately to highly vulnerable. Given the higher and uniform livelihood exposure to flooding across all wards, vulnerability reduction needs interventions to enhance adaptive capacity rather than focusing on hazard reduction. Strengthening climate information access, community-based organizations, and resilient infrastructure, livelihood diversification promotion, improving veterinary services, disaster management support, and improving financial and insurance services access will improve livestock farmers’ resilience. These recommendations corroborate the previous studies, emphasizing adaptive capacity investment strategies as the most effective way in reducing livelihood vulnerability due to climate challenges to rural communities .
5. Conclusion and Recommendations
This study investigated the livestock farmers’ household livelihood vulnerability to flood risk in Kilosa District, Morogoro, Tanzania. The assessment of livelihood vulnerability to flood risk through the LVI-IPCC framework highlighted higher exposure of all study wards to flooding (E=1). Despite uniform exposure, variations in the levels of vulnerability were observed, mainly due to differences in sensitivity and adaptive capacity levels among the wards. Madoto (LVI-IPCC=0.488), Msowero (LVI-IPCC=0.482), and Mvumi (LVI-IPCC=0.462) were most vulnerable mainly due to low adaptive capacity, while Parakuyo ward (LVI-IPCC=0.332) was least vulnerable despite its higher sensitivity level, owing to strong adaptive capacity. Tindiga (LVI-IPCC=0.411) and Mbigiri (LVI-IPCC=408) exhibited a moderate level of livelihood vulnerability, reflecting sensitivity and adaptive capacity balance. The overall LVI-IPCC (0.431) indicates moderately to highly livestock farmers’ household livelihood vulnerability to flood risk in the study area. These results demonstrate unavoidable flooding exposure across the study area; household capacity to cope with, prepare for, and recover flood shock influence the extent of livestock farmers’ household livelihood vulnerability. Hence, minimizing vulnerability for livestock farmers needs interventions that will strengthen adaptive capacity through improved availability of climate information, support services to livestock production, access to financial resources, diversification opportunities for the livelihood, and community-based programs for management of disaster risks. These capacities will minimize the adverse impacts of flooding and build sustainable and long-term resilience for livestock farmers in Kilosa District and in other flood-prone areas.
Abbreviations

LVI-IPCC

Livelihood Vulnerability Index-Inter-govern Mental Panel for Climate Change

SLF

Sustainable Livelihood Framework

DFID

Department for International Development

Acknowledgments
The authors of this study acknowledging the Kilosa District officials and local livestock farmers for their participation in this study.
Authors Contributions
Omary Ally Mafitah: Conceptualization, Data curation, Formal Analysis, Investigation, Methodology, Writing – original draft, Writing – review & editing
Greyson Zabron Nyamoga: Conceptualization, Supervision, Validation, Visualization, Writing – review & editing
David Dawson Maleko: Conceptualization, Supervision, Validation, Visualization, Writing – review & editing
Data Availability Statement
The data are available to the corresponding author upon a special and reasonable request
Conflicts of Interest
The authors declare no conflicts of interest.
References
[1] Adger, W. N. Vulnerability. Global. Environmental Change; 2006, 16(3), 268-281.
[2] Akram, A., Tahir A., Alam A., & Waheed A. Livelihood vulnerability index: Assessment of climatic changes in flood affected areas of Mianwali district, Punjab, Pakistan; 2025.
[3] Anane, E. Module for Post-Graduate Diploma in Education Programme. EPS761P: Research Methods in Education. IoE/MoF/TUC/GHANA CARES TRAINING AND RETRAINING PROGRAMME FOR PRIVATE SCHOOL TEACHERS; 2022.
[4] Below, T. B., Mutabazi, K. D., Kirschke, D., Franke, C., Sieber, S., Siebert, R., & Tscherning, K. Can farmers’ adaptation to climate change be explained by socio-economic household-level variables? Global Environmental Change; 2012, 22(1), 223-235.
[5] Deressa, T., Hassan, R. M., & Ringler, C. Measuring Ethiopian Farmers’ Vulnerability to Climate Change across Regional States. IFPRI Discussion Paper 00806; 2008.
[6] DFID. Sustainable Livelihoods Guidance Sheets. Department for International Development, UK; 1999.
[7] DM Act. The Gazette of India. Extraordinary. Disaster Management Act, No. 53 of 2005. New Delhi, the 26th December, 2005/ Pausa 5, 1927 (Saka); 2005.
[8] FWM Act. Flood and Water Management Act 2010 (c. 29). (Document Generated: 2018-11-16); 2010.
[9] Hahn, M. B., Riederer A. M., & Foster S. O. The livelihood vulnerability index. A pragmatic approach to assessing risks from climate variability and change. A case study in Mozambique. Global Environmental Change; 2009, 19(1), 74-88.
[10] IPCC. Climate change 2014: Impacts, Adaptation, and Vulnerability. Contribution of Working Group II to the Fifth Assessment Report of the Intergovernmental Panel on Climate Change. Cambridge University Press; 2014.
[11] JICA. Annual report. Boosting Growth. Japan International Cooperation Agency. Aiming for Inclusive and Dynamic Development; 2010.
[12] Kayastha, R. B., Lee, W. K., Shrestha N., Wang S. W. Assessing the Livelihood Vulnerability of Nomads to Changing Climate in the Third Pole Region of Nepal; 2023.
[13] NBS. The United Republic of Tanzania (URT), Ministry of Finance and Planning, Tanzania National Bureau of Statistics and President’s Office - Finance and Planning, Office of the Chief Government Statistician, Zanzibar. The 2022 Population and Housing Census: Administrative Units Population Distribution Report; Tanzania; December 2022.
[14] RALG. District risk, vulnerability and capacity assessment report. Kilosa district council; 2015.
[15] RALG. KILOSA DISTRICT COUNCIL STRATEGIC PLAN 2021/2022-2025/2026; 2020.
[16] UN, (2004). Living with Risk: A global review of disaster reduction initiatives. International Strategy for Disaster Reduction (ISDR); 2004, Version - Volume I.
[17] Venus, T. E, Bilgram, S., Sauer, J., Chettri, A. K. Livelihood Vulnerability and climate change: a comparative analysis of smallholders in the Indo-Gangetic plains. Environ Dev Sustain 24, 1981-2009 (2022); 2021,
[18] Wang, L., Cui, S., Li, Y., Huang, H., Manandhar, B., Nitivattananon, V., Fang, X., & Huang, W. Review of the flood management: from flood control to flood resilience. Heliyon; 2022, 8(11).
[19] Getacher, T., Bizuneh, A., Berhane, G., Mebrahtom, G. & Eshetie, M. Investigation of Flood incidence causes and mitigation: Case study of Ribb River, northwestern Ethiopia. Natural Hazards Research; 2023,
[20] IFRC. Tanzania/ Floods and Land side. International Federation of Red Cross and Red Crescent Societies; 2023, Operation update #4: MDRTZ035.
[21] Kundzewicz, Z. W., Budhakooncharoen, S., Bronstert, A., Hoff, H., Lettenmaier, D., Menzel, L., & Schulze, R. Coping with variability and change: Floods and droughts. Natural Resources Forum; 2002, 26 (2002) 263-274.
Cite This Article
  • APA Style

    Mafitah, O. A., Nyamoga, G. Z., Maleko, D. D. (2026). Assessment of Household Livelihood Vulnerability to Flood Risks Among the Livestock Farmers in Kilosa District, Morogoro-Tanzania. International Journal of Environmental Protection and Policy, 14(5), 105-117. https://doi.org/10.11648/j.ijepp.20261405.11

    Copy | Download

    ACS Style

    Mafitah, O. A.; Nyamoga, G. Z.; Maleko, D. D. Assessment of Household Livelihood Vulnerability to Flood Risks Among the Livestock Farmers in Kilosa District, Morogoro-Tanzania. Int. J. Environ. Prot. Policy 2026, 14(5), 105-117. doi: 10.11648/j.ijepp.20261405.11

    Copy | Download

    AMA Style

    Mafitah OA, Nyamoga GZ, Maleko DD. Assessment of Household Livelihood Vulnerability to Flood Risks Among the Livestock Farmers in Kilosa District, Morogoro-Tanzania. Int J Environ Prot Policy. 2026;14(5):105-117. doi: 10.11648/j.ijepp.20261405.11

    Copy | Download

  • @article{10.11648/j.ijepp.20261405.11,
      author = {Omary Ally Mafitah and Greyson Zabron Nyamoga and David Dawson Maleko},
      title = {Assessment of Household Livelihood Vulnerability to Flood Risks Among the Livestock Farmers in Kilosa District, Morogoro-Tanzania},
      journal = {International Journal of Environmental Protection and Policy},
      volume = {14},
      number = {5},
      pages = {105-117},
      doi = {10.11648/j.ijepp.20261405.11},
      url = {https://doi.org/10.11648/j.ijepp.20261405.11},
      eprint = {https://article.sciencepublishinggroup.com/pdf/10.11648.j.ijepp.20261405.11},
      abstract = {Flood risk is a challenge extending physical exposure to encompass household livelihood vulnerability. This study explored livestock farmers’ household livelihood vulnerability to flood risk in Kilosa District, Morogoro, Tanzania. Using the Livelihood Vulnerability Framework (LVI-IPCC), the study highlighted social-demographic profile, livelihood strategies, social networks, health, food, water, natural disasters and climate variability, and flood coping and adaptation capacity as the key contributors to livestock farmers’ household livelihood vulnerability to flood risk. The questionnaires and interview methods were used to collect data from 138 respondents. The data were processed using SPSS Version 20, with descriptive and Livelihood Vulnerability Framework (LVI-IPCC) approaches. The findings highlighted uniform exposure of the study wards to flooding impacts, whereby the overall LVI-IPCC (0.431) indicated moderately to highly household livelihood vulnerability to flood risk. Despite these challenges, communities demonstrated resilience through relocation of livestock (35.5%), using savings (33.3%), selling livestock to cover costs (65.9%), and borrowing (13.8%). Diversification into alternative income-generating activities such as crop farming and trading was prevalent. Weak infrastructure and support systems hindered long-term resilience. Since local adaptive approaches provided essential short-term relief, there is a need for integrated policy interventions to enhance adaptive capacity. Addressing household livelihood vulnerability provides a comprehensive understanding for building sustainable livestock-based livelihoods in the face of increasing climate change and variability.},
     year = {2026}
    }
    

    Copy | Download

  • TY  - JOUR
    T1  - Assessment of Household Livelihood Vulnerability to Flood Risks Among the Livestock Farmers in Kilosa District, Morogoro-Tanzania
    AU  - Omary Ally Mafitah
    AU  - Greyson Zabron Nyamoga
    AU  - David Dawson Maleko
    Y1  - 2026/09/09
    PY  - 2026
    N1  - https://doi.org/10.11648/j.ijepp.20261405.11
    DO  - 10.11648/j.ijepp.20261405.11
    T2  - International Journal of Environmental Protection and Policy
    JF  - International Journal of Environmental Protection and Policy
    JO  - International Journal of Environmental Protection and Policy
    SP  - 105
    EP  - 117
    PB  - Science Publishing Group
    SN  - 2330-7536
    UR  - https://doi.org/10.11648/j.ijepp.20261405.11
    AB  - Flood risk is a challenge extending physical exposure to encompass household livelihood vulnerability. This study explored livestock farmers’ household livelihood vulnerability to flood risk in Kilosa District, Morogoro, Tanzania. Using the Livelihood Vulnerability Framework (LVI-IPCC), the study highlighted social-demographic profile, livelihood strategies, social networks, health, food, water, natural disasters and climate variability, and flood coping and adaptation capacity as the key contributors to livestock farmers’ household livelihood vulnerability to flood risk. The questionnaires and interview methods were used to collect data from 138 respondents. The data were processed using SPSS Version 20, with descriptive and Livelihood Vulnerability Framework (LVI-IPCC) approaches. The findings highlighted uniform exposure of the study wards to flooding impacts, whereby the overall LVI-IPCC (0.431) indicated moderately to highly household livelihood vulnerability to flood risk. Despite these challenges, communities demonstrated resilience through relocation of livestock (35.5%), using savings (33.3%), selling livestock to cover costs (65.9%), and borrowing (13.8%). Diversification into alternative income-generating activities such as crop farming and trading was prevalent. Weak infrastructure and support systems hindered long-term resilience. Since local adaptive approaches provided essential short-term relief, there is a need for integrated policy interventions to enhance adaptive capacity. Addressing household livelihood vulnerability provides a comprehensive understanding for building sustainable livestock-based livelihoods in the face of increasing climate change and variability.
    VL  - 14
    IS  - 5
    ER  - 

    Copy | Download

Author Information