2. Experimental Methods
ISO 22157 requires a full-culm bending test
, but not a small split bending test. The full-culm test can be challenging to perform because it requires a lengthy specimen (a minimum span length of 30D is required), which equates to high deflections that necessitate a varied test configuration and a series of saddles’ to complete the test. In practice, a four-point bending test is improbable in developing country like Ethiopia, due to the cost and size of the necessary test equipment. Bamboo is often characterized as a unidirectional fiber-reinforced material along the longitudinal axis, prompting certain researchers
| [21] | J. Gottron, K. A. Harries, and Q. Xu, “Creep behaviour of bamboo,” Constr. Build. Mater., vol. 66, pp. 79–88, 2014, https://doi.org/10.1016/j.conbuildmat.2014.05.024 |
| [22] | M. J. Richard, J. Gottron, K. A. Harries, and K. Ghavami, “Experimental evaluation of longitudinal splitting of bamboo flexural components,” Proc. Inst. Civ. Eng. Struct. Build., vol. 170, no. 4, pp. 265–274, 2017,
https://doi.org/10.1680/jstbu.16.00072 |
| [23] | C. Gauss, H. Savastano, and K. A. Harries, “Use of ISO 22157 mechanical test methods and the characterisation of Brazilian P. edulis bamboo,” Constr. Build. Mater., vol. 228, p. 116728, 2019, https://doi.org/10.1016/j.conbuildmat.2019.116728 |
[21-23]
to recommend the execution of a small coupon flexural test. As a result, the ASTM D7264-15 Standard Test Method for Flexural Properties of Polymer Matrix Composite Materials
| [24] | ASTM D7264, “Standard Test Method for Flexural Properties of Polymer Matrix Composite Materials,” 2015. ASTM International, West Conshohocken, Pennsylvania, USA. |
[24]
was adopted. A three-point bending test (
Figure 1d; ASTM D7264 Procedure A) was chosen to increase the test shear span while minimizing shear effects.
2.1. Materials and Methods
The highland bamboo (
Oldeania alpina) culms utilized in this study were 3-5 years old and sourced from Hagere-Selam, the Sidama region of Ethiopia. Its elevation is 2794 m above sea level, and its latitude and longitude are 6°29′N 38°31′E. No-flaw bamboo culms were felled and brought to the lab as study samples (
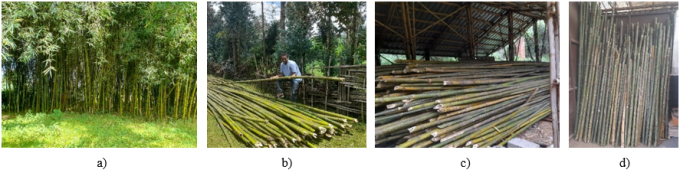
Figure 1). After curing under ambient air conditioning without direct sunshine for several months, the culms were air-dried and bending specimens were taken from separate culms. All culm materials were cut at different longitudinal (bottom B, middle M, top T) locations, and two types of specimens—one with nodes (in the middle) and one without—were made for mechanical property testing. The coupons were sanded flat along the thickness direction due to the culm wall's curvature. Fifteen samples of each bamboo positions were placed in an oven set at 103 ± 2°C for 24 hours in order to assess the moisture contents (MC) of the culms evaluated in this study. The moisture content was approximately 10.23%.
Figure 1. a) Bamboo farm in Hagere Selam, b) Harvested bamboo, c) Bamboo storage, d) Randomly selected bamboo stored in laboratory.
The specimen size was chosen so that the flexural properties can be accurately assessed during the testing. For flexural strength, the standard support span-to-thickness ratio is set so that failure occurs exclusively on the specimens’ outer surface due to the bending moment. The test span length to sample thickness ratio was strictly controlled (typically ≥ 20) to ensure beam-like behavior, minimize shear effects, and emphasize bending in accordance with ASTM D7264
| [24] | ASTM D7264, “Standard Test Method for Flexural Properties of Polymer Matrix Composite Materials,” 2015. ASTM International, West Conshohocken, Pennsylvania, USA. |
[24]
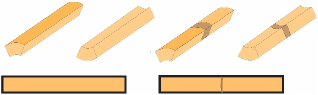
. The shear span to depth ratio was greater than 10, which exceeded the minimum recommended ratio of 8. This test configuration was chosen to reduce out-of-plane shear deformations and avoid short beam failure types. The specimens used in the bending test had dimensions of 4.91 to 9.37 mm in the radial direction (which corresponds to the thickness of the sanded culm wall), 12.81 to 29.71 mm in the tangential direction, and 235 to 270 mm in the longitudinal direction. They were tested in four distinct ways since there were two alternative test orientations that could cause the outer culm wall to be either compressed (OC) or tensioned (OT).
Figure 2 depicts a schematic of the test orientation.
Figure 2. Schematic description of specimens with and without node along different orientations.
2.2. Three-point Bending Tests
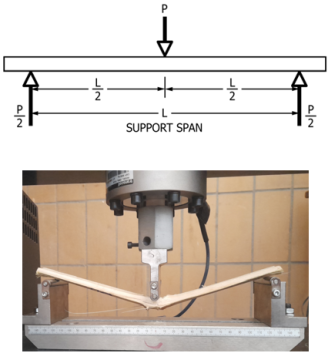
Three-point bending tests was performed on the prepared specimens in accordance with ASTM D7264/D7264M-15. A 100 kN universal testing equipment was used to centrally load a simple supported beam specimen (
Figure 3), and a load cell measured the force delivered. The tester beam's movement produced the correct mid-span deflection. The beam specimen was loaded at a consistent speed until the samples failed or ruptured on the external and interior culm surfaces (external surface and inner skin), and the effect of node presence on flexural properties was investigated.
Figure 3. The Experimental setup used for flexural testing.
For specimens with dimensions that differ significantly from the standard dimensions (32:1 span-to-thickness ratio)
| [24] | ASTM D7264, “Standard Test Method for Flexural Properties of Polymer Matrix Composite Materials,” 2015. ASTM International, West Conshohocken, Pennsylvania, USA. |
[24]
, the procedure described in Test Methods ASTM D790 can be used to generate a crosshead rate that results in a similar rate of straining at the outer surface
| [25] | ASTM D790, “Standard Test Methods for Flexural Properties of Unreinforced and Reinforced Plastics and Electrical Insulating Materials1 This,” 2017. ASTM International, West Conshohocken, Pennsylvania, USA.
https://doi.org/10.1520/D0790-17.2 |
[25]
. After a few tests, the test was run at a loading rate determined by Equation (
1) to ensure that the specimens failed within 300 ± 120 seconds. The required ambient conditions (23 ± 3°C, 65 ± 5%) were maintained prior to the bending tests in compliance with ISO 22157:2019. The three-point bending test was used to get the MOR and MOE values. Adjust the machine to the crosshead motion rate determined by Equation (
1):
where: R = rate of crosshead motion, mm (in.)/min; L = support span, mm (in.), t = thickness of the specimen, mm (in.), and Z = rate of straining of the outer fiber, mm/mm/min (in./in./min). Z shall be equal to 0.01.
The modulus of rupture,
is located directly under the center force application member, and based on an assumption of a homogeneous, elastic material, it was determined by Eqn. (
2):
where P is the maximum applied load at midspan, L is the simple test span and b and t are specimen width and thickness of the specimen, respectively.
The apparent axial modulus of the homogeneous specimen derived from bending,
, is determined from the midspan displacement,
. For three-point bending: Eqn. (
3) was used to calculate the modulus of elasticity:
where, = modulus of elasticity in flexure, P = load at proportional limit, b = width of sample (mm), t = thickness of specimen (mm), L = span length b/n points of supports of the specimen (mm), = deflection by load P (mm).
The maximum strain at the outer surface also occurs at mid-span, and it is calculated from geometry, not directly measured. Flexural strain can be given by using Equation (
4).
where: = maximum strain at the outer surface, mm/mm; = mid-span deflection, mm; L = support span, mm; t = thickness of specimen, mm.
2.3. Data Analysis Procedure
To investigate the data’s statistical distributions, normality tests and other statistical distribution tests were performed. Minitab 20.3 was used to conduct all statistical analyses. The distribution’s asymmetry and tailing in relation to a normally distributed population were measured using skewness and kurtosis
| [26] | S. Yusoff and Y. Wah, “Comparison of conventional measures of skewness and kurtosis for small sample size,” in ICSSBE 2012 - Proceedings, 2012 International Conference on Statistics in Science, Business and Engineering: “Empowering Decision Making with Statistical Sciences,” 2012, pp. 518–523, https://doi.org/10.1109/ICSSBE.2012.6396619 |
[26]
. Skewness and kurtosis values of zero indicate that observed data is perfectly regularly distributed. The recorded data distributions are of an acceptable normal distribution (less than ±1, less than ±2)
| [27] | H.-Y. Kim, “Statistical notes for clinical researchers: assessing normal distribution (2) using skewness and kurtosis,” Restor. Dent. Endod., vol. 38, no. 1, p. 52, 2013,
https://doi.org/10.5395/rde.2013.38.1.52 |
[27]
. The acquired data were analyzed using analysis of variance (ANOVA) at 0.05 levels of significance to determine the true influence of isolated components (node presence, loading orientation and longitudinal position), as well as their interactions, on the values of flexural properties under inquiry.
3. Result and Discussion
3.1. Descriptive Statistics of Flexural Properties
As a biological material, bamboo is naturally heterogeneous, and the descriptive analysis of 180 split bamboo samples offered important insights into the core tendencies and intrinsic variability of essential flexural properties.
Table 1 displays the dimensions and flexural characteristics, as well as their averages, skewness, kurtosis, coefficients of variation, and minimum and maximum values. Geometric dimensions (T = thickness, mm; b = width, mm; L = span length, mm), loading and deformation parameters (P = flexural load, N; δ = displacement, mm; ε = strain, %) and mechanical characteristics (MOR = modulus of rupture, MPa;
= modulus of elasticity in flexure, GPa) were all included in the data. All of the variables had skewness’s between 0.01 and 1.27 and kurtosis between -0.60 and 1.34. According to
| [27] | H.-Y. Kim, “Statistical notes for clinical researchers: assessing normal distribution (2) using skewness and kurtosis,” Restor. Dent. Endod., vol. 38, no. 1, p. 52, 2013,
https://doi.org/10.5395/rde.2013.38.1.52 |
[27]
, the recorded data distributions showed a good degree of normality. Values < ± 2 are considered acceptable, while values between ±1 are considered excellent.
Overall, the findings showed the moderate amount of variability, which was typical of biological materials and was impacted by environmental growth circumstances, node presence and fiber distribution. The majority of variables exhibited positive skewness, indicating that distributions with tails pointing upward were advantageous from the standpoint of material selection, perhaps leading to the selection of superior samples for engineering applications. The kurtosis values demonstrated that bamboo properties did not always follow a normal distribution, supporting the use of non-parametric statistics or careful data transformation in advanced analyses. While some distributions (like load) had heavier tails and a sharper peak than a normal distribution, others (like MOR) had lighter tails and a flatter peak. This is consistent with research by
| [28] | W. Li, S. Liu, and J. Liu, “Experimental and mesoscale numerical investigation of the mechanical behavior and failure modes of bamboo,” J. Mater. Sci., vol. 60, no. 4, pp. 1936–1951, 2025, https://doi.org/10.1007/s10853-024-09616-2 |
[28]
, who found that the mechanical properties of bamboo had non-normal, right-skewed distributions, highlighting the need of statistical characterization over straightforward mean reporting.
Remarkably, strain had a skewness of 0.01 and a CoV of 20.33%. According to research on the failure mechanisms of bamboo composites, the material's ultimate failure strain is a more inherent property, and it tends to fail at a highly constant strain behavior across samples, regardless of how thick or strong the sample is
| [28] | W. Li, S. Liu, and J. Liu, “Experimental and mesoscale numerical investigation of the mechanical behavior and failure modes of bamboo,” J. Mater. Sci., vol. 60, no. 4, pp. 1936–1951, 2025, https://doi.org/10.1007/s10853-024-09616-2 |
[28]
. According to
, the composite's ductile failure including fiber pull-out and matrix cracking was reflected in the mean failure strain (~1.53%), which is in line with the normal failure strain range for bamboo in bending (1-2%).
Table 1. Descriptive statistics of dimensions and flexural properties and results from the flexure test.
Variable | No. | Mean | StDev | CoV | Min | Max | Skewness | Kurtosis |
T | 180 | 6.52 | 1.09 | 16.73 | 4.91 | 9.37 | 0.51 | -0.60 |
b | 180 | 20.72 | 4.16 | 20.09 | 12.81 | 29.71 | 0.18 | -0.49 |
L | 180 | 248.96 | 8.97 | 3.60 | 235 | 270 | 1.26 | 0.70 |
P | 180 | 451.1 | 266.2 | 59.01 | 116.5 | 1231.5 | 1.27 | 1.34 |
δ | 180 | 21.77 | 5.50 | 25.25 | 10.08 | 37.50 | 0.47 | 0.63 |
ε | 180 | 1.35 | 0.27 | 20.33 | 0.58 | 2.04 | 0.01 | 0.90 |
MOR | 180 | 179.74 | 57.75 | 32.13 | 104.92 | 308.62 | 0.72 | -0.36 |
| 180 | 13.78 | 4.78 | 34.72 | 5.660 | 28.98 | 0.91 | 0.50 |
With a range of up to 308.62 MPa, the CoV of MOR (32.13%) indicates strong bending strength. The majority of values appeared to cluster around the mean, with fewer low outliers, according to positive skewness (0.72) and somewhat negative kurtosis (-0.36). Although more variable than MOR, the CoV of
(34.72%) showed good rigidity, with skewness (0.91) moving toward higher values. Variations in fiber density, vascular bundle distribution and the presence or absence of nodes along the culm all contributed to the diversity in MOR and
. According to
| [30] | L. S. Vivas, G. Mullins, J. A. Cunningham, and J. R. Mihelcic, “Mechanical properties of bamboo: a research synthesis of strength values and the factors influencing them,” J. Amer. Bamboo Soc, vol. 29, pp. 1–21, 2019. |
[30]
, bamboo’s biological heterogeneity (growth circumstances, culm maturity, node presence) and specimen preparation parameters (cutting, moisture conditioning, knot removal) are responsible for the variability in CoVs for
and MOR, which they reported to be between 20 and 35%.
The material’s mean
of 13.78 GPa and MOR of 179.74 MPa, which were within the competitive range of globally studied bamboo species and frequently surpass those of processed forms while exhibiting comparable variability, were found in Ethiopian highland bamboo samples. According to studies on
Guadua angustifolia and
Dendrocalamus, three-point bending tests provided
values of 10–20 GPa and MOR values of 150–250 MPa
| [31] | J. F. Correal and J. Arbeláez, “Influence of age and height position on Colombian Guadua angustifolia bamboo mechanical properties,” Maderas. Cienc. y Tecnol., vol. 12, no. 2, pp. 105–113, 2010, [Online]. Available:
https://api.semanticscholar.org/CorpusID:137125905 |
[31]
. The anisotropic nature of bamboo was highlighted by the flexural MOE of the common species Moso bamboo (
Phyllostachys pubescens), which has been measured at about 10-12 GPa
and nearly matches the mean.
| [30] | L. S. Vivas, G. Mullins, J. A. Cunningham, and J. R. Mihelcic, “Mechanical properties of bamboo: a research synthesis of strength values and the factors influencing them,” J. Amer. Bamboo Soc, vol. 29, pp. 1–21, 2019. |
[30]
synthesized 43 articles and found that, depending on the species and testing conditions, bamboo MOR values ranged from 100 to 300 MPa and
between 10 and 20 GPa.
3.2. Executive Summary of Statistical Significance
The primary effects (node presence [N], culm location [L] and loading orientation [D]) and their interactions on the flexural characteristics of 180 split bamboo samples were evaluated for statistical significance using a three-way ANOVA. These characteristics were
, MOR, δ and ε. Significant impacts were indicated by p-values less than 0.05, which showed how these variables affected bamboo’s bending behavior. The findings showed that node presence and loading orientation were the main factors influencing flexural performance, while position had secondary geometric effects. Interactions varied in significance among features, which helps engineers choose and design materials for engineering applications. A well-established yet essential hierarchy in bamboo mechanics was confirmed by the investigation.
Table 2 summarizes the p-values, providing an immediate overview of what factors govern each property.
Table 2. The p-values of the three-way ANOVA for flexural characteristics.
Factor / Interaction | | MOR | δ | ε |
N | p<0.001 | p<0.001 | p=0.002 | p=0.048 |
D | P<0.001 | p=0.001 | p=0.078 | p=0.158 |
L | p=0.036 | p=0.083 | p<0.001 | p=0.489 |
N × D | p=0.073 | p=0.699 | p=0.093 | p=0.062 |
N × L | p=0.060 | p=0.115 | p=0.100 | p=0.349 |
L × D | p=0.630 | p=0.134 | p=0.006 | p=0.020 |
N × L × D | p=0.836 | p=0.078 | p=0.275 | p=0.618 |
3.2.1. Main Effects: The Hierarchical Controllers
Node presence was the most significant factor for all material properties. The node was confirmed to be the foundation of bamboo’s mechanical integrity, with overwhelmingly substantial effects on
and MOR, and modest significance for δ and ε. According to
| [10] | X. Wang, S. Yu, S. Deng, R. Xu, Q. Chen, and P. Xu, “Effect of Bamboo Nodes on the Mechanical Properties of Phyllostachys iridescens,” Forests, vol. 15, no. 10. p. 1740, 2024, https://doi.org/10.3390/f15101740 |
| [11] | D. Taylor, B. Kinane, C. Sweeney, D. Sweetnam, P. O’Reilly, and K. Duan, “The biomechanics of bamboo: investigating the role of the nodes,” Wood Sci. Technol., vol. 49, no. 2, pp. 345–357, 2015,
https://doi.org/10.1007/s00226-014-0694-4 |
[10, 11]
, nodes are crucial elements that greatly increase stiffness and strength by preventing interlaminar shear and buckling. This function was evident in the stark performance difference between nodal and internodal sections. Nodes changed the arrangement of fibres to increase stiffness and strength and provided diaphragms that resist deformation, even if they had a minor impact on ductility
| [10] | X. Wang, S. Yu, S. Deng, R. Xu, Q. Chen, and P. Xu, “Effect of Bamboo Nodes on the Mechanical Properties of Phyllostachys iridescens,” Forests, vol. 15, no. 10. p. 1740, 2024, https://doi.org/10.3390/f15101740 |
[10]
.
The functionally graded, anisotropic composite structure of bamboos was distinguished by a loading orientation that significantly influenced the
and MOR. Utilizing bamboo's graded microstructure, the ratio of outer compression (OC) to outer tension (OT) increased stiffness and rupture resistance in OC orientations because denser outer fibers can handle compressive loads better. According to
| [33] | M. K. Habibi and Y. Lu, “Crack propagation in bamboo’s hierarchical cellular structure,” Sci. Rep., vol. 4, no. 1, p. 5598, 2014. |
[33]
, performance was limited in tension by the weaker inner parenchyma and dictated in compression by the robust outer fibers due to the radial density gradient. OT gives somewhat higher readings but has no effect on strain and displacement, hence the overall deformation at failure was statistically similar even if the orientation affects the path to failure.
There was an intriguing divide in influence by location. It was the predominant factor for displacement but not for strain, and it was significant for
but not for MOR, suggesting that variation along culms was driven by geometry (thickness) rather than material. This implies that although while the internal strength of the material was rather consistent throughout the culm, the top sections deflected considerably more than the bottom due to the geometric tapering, or decreased thickness at the top.
| [34] | U. G. K. Wegst, H. Bai, E. Saiz, A. P. Tomsia, and R. O. Ritchie, “Bioinspired structural materials,” Nat. Mater., vol. 14, no. 1, pp. 23–36, 2015, https://doi.org/10.1038/nmat4089 |
[34]
highlighted biomimetic principles, which are in line with this effective utilization of material. The lack of significance for strain suggests that, in spite of variations in stiffness and thickness, the eventual material failure strain was a more intrinsic feature that remains mostly constant along the culm
| [35] | N. Khodabakhshi, T. Mouka, E. G. Dimitrakopoulos, D. Trujillo, and A. Khaloo, “Analytical and experimental investigations on failure of bamboo culms in bending: Effects of shear-tension interaction and bimodulus material behavior,” Eng. Struct., vol. 353, p. 122328, 2026,
https://doi.org/10.1016/j.engstruct.2026.122328 |
[35]
.
These primary effects were consistent with bamboo's hierarchical structure, in which location reflects growth-related variability and modified stiffness and ductility through taper-related gradients, while nodes and outer layers offered mechanical advantages. The significant variation in stiffness along the culm frequently peaked in the middle. The population-wide variance in strength was less pronounced and not significant. A direct geometric consequence of the culm’s prominent taper (thickness gradient) was the dominant effect on displacement. A basic principle of beam mechanics states that thinner top parts deflect more.
3.2.2. Pairwise Synergies and Significant Interactions: Uncovering Context-Dependent Behavior
The notable interaction terms were not statistical variances; instead, they offered profound engineering insights crucial for predictive modeling and design. They also revealed context-dependent influences, the conditional logic of bamboo's performance where the variables ceased acting independently and began influencing one another.
The N × D interaction was the most impactful finding. When paired with optimal loading, the node's effect was co-adapted to work synergistically, creating an ultra-efficient load path, according to the descriptive data and significance (for
). When the bamboo was loaded in its optimal, natural orientation (outside compression), the node's reinforcing power was significantly increased. This implies that the architecture of the node has been evolved to cooperate best with the robust outer fibers during compression. Even if the impacts of nodes and anisotropy alone have been extensively researched,
| [34] | U. G. K. Wegst, H. Bai, E. Saiz, A. P. Tomsia, and R. O. Ritchie, “Bioinspired structural materials,” Nat. Mater., vol. 14, no. 1, pp. 23–36, 2015, https://doi.org/10.1038/nmat4089 |
[34]
explained the idea of integrated biological design, and this important relationship measuring their interaction is a more sophisticated understanding.
According to the context-dependent node (N × L), node impacts on stiffness and displacement may change depending on the position of the culm. This could be because node density or fiber maturity varies with height. Its main function changed to improve ductility and toughness (δ increased by 32%, strain by 19.8%) in the weak top, while its strengthening effect was greatest in the middle portion of excellent property. This demonstrates the node's multifunctionality: it served as a strength amplifier in resilient areas, with effects influenced by local culm geometry and material properties, while functioning as a damage-tolerant fusion in more susceptible sections, a complex role emphasized in fracture studies by
.
The failure-mode interaction (L × D) demonstrates how thickness affected the mechanical effect of loading orientation. This suggests that the position of the culm influenced the direction of stress and deformation, with upper parts possibly being more flexible in either orientation. OC gave the thick bottom a significant strength advantage. However, OT loading caused significantly greater strain and deformation in the thin top, indicating a change from brittle outer-fiber failure to ductile inner-core crushing mode. This is essential for comprehending the mechanisms of failure in various culm sections. It is likely related to the fact that distinct failure modes (ductile inner core crushing versus brittle outside fiber rupture) were more or less noticeable in sections of varying thicknesses and maturities
| [28] | W. Li, S. Liu, and J. Liu, “Experimental and mesoscale numerical investigation of the mechanical behavior and failure modes of bamboo,” J. Mater. Sci., vol. 60, no. 4, pp. 1936–1951, 2025, https://doi.org/10.1007/s10853-024-09616-2 |
[28]
.
3.2.3. Non-significant Effects and Their Meaning
There was no additional layer of context-dependence that needs to be explained, indicating no higher-order synergy among all three factors; pairwise interactions were sufficient to explain variability; the absence of a significant three-way interaction (N × L × D) for all properties indicates that the complex interplay of the two-way interactions was stable. It implies that even while the elements interact in pairs, the combined three-way effect was not a special hidden phenomenon but rather the sum of the two-way interactions.
3.3. Categorical Effects on Bamboo Flexural Properties
With respect to overall performance and the effects of loading orientation (outer compression/OC vs. outer tension/OT), node presence (with node vs. without node) and longitudinal location along the culm (bottom, middle, top), the tabulated data in
Table 3 presents mean values for key flexural properties. These values were consistent with typical bamboo values, but they exhibited different trends across subcategories.
Table 3. The mean flexural properties of categorical effects.
Category | Subcategory | MOE | MOR | P | δ | ε | t |
Loading Orientation | OC | 15.38 | 195.21 | 488.81 | 21.42 | 1.32 | 6.48 |
OT | 12.18 | 165.42 | 406.97 | 22.52 | 1.38 | 6.51 |
Node Effects | Without Node | 10.81 | 133.83 | 332.85 | 20.49 | 1.28 | 6.64 |
With Node | 16.08 | 216.50 | 537.29 | 23.15 | 1.41 | 6.37 |
Location Effects | Bottom | 13.54 | 185.34 | 719.95 | 18.42 | 1.38 | 7.66 |
Middle | 15.29 | 192.51 | 377.10 | 22.60 | 1.30 | 6.17 |
Top | 12.20 | 159.69 | 225.92 | 25.21 | 1.37 | 5.58 |
3.3.1. The Gradient Effect and Loading Orientation: Confirmation of Functional Grading
and MOR were significantly impacted by loading orientation, but not δ or ε. Better resistance to bending deformation and failure was shown by the OC orientation, which produced an 18% higher MOR and a 26% higher
than OT. Bamboo’s radial anisotropy, a characteristic of a functionally graded composite construction, was highlighted by this asymmetry, which is a typical feature of a composite beam where the strongest material is offset from the neutral axis
| [36] | F. Wang et al., “Study on the influence of node part on the bending behaviors of bamboo,” Ind. Crops Prod., vol. 204, p. 117384, 2023. https://doi.org/10.1016/j.indcrop.2023.117384 |
| [37] | W. Sae-Long et al., “Flexural Testing on Dendrocalamus Bamboo in Thailand: Mechanical Properties, Structural Performance, and Engineering Applications,” J. Mater. Civ. Eng., vol. 37, no. 5, p. 4025103, 2025.
https://doi.org/10.1061/JMCEE7.MTENG-19648 |
[36, 37]
. Because bamboo was relatively brittle under tension parallel to the fibres, it reached its failure strain more quickly when loaded in OT, which resulted in lower overall MOR and
values. Because bamboo's anisotropic fiber structure resisted compressive forces better than tensile ones, the OC orientation was obviously superior. According to
| [33] | M. K. Habibi and Y. Lu, “Crack propagation in bamboo’s hierarchical cellular structure,” Sci. Rep., vol. 4, no. 1, p. 5598, 2014. |
[33]
work, this basic mechanical principle in bamboo describes how radial heterogeneity determines fracture propagation routes and mechanical performance, making bamboo’s behavior extremely reliant on loading orientation. Similar to other studies on other bamboo species, such
Phyllostachys pubescens | [38] | X. Li, H. Ye, S. Han, M. Li, H. Lin, and G. Wang, “Effects of bamboo nodes on mechanical properties of thin-type bamboo bundle laminated veneer lumber (BLVL): From anatomical structure to penetration mechanism,” Ind. Crops Prod., vol. 203, p. 117119, 2023.
https://doi.org/10.1016/j.indcrop.2023.117119 |
[38]
, the finding of a 19–35% performance differential based on orientation highlights a non-negotiable design criterion for bamboo buildings.
OT loading increased ductility, as seen by slightly higher strain (4.5%) and displacement (5.2%). Bamboo's graded microstructure was thought to be the cause of the differences; denser outer fibers performed better under compression, while the inner layers were more compliant, resulting in earlier tensile failure in OT configurations. This suggests that even though the failure stress was lower in OT, the failure deformation may be similar or greater, possibly involving a more ductile, crushing failure of the inner parenchyma. The significance of orienting split bamboo with the outer side in compression for load-bearing applications was shown by this asymmetry. However, the lack of significance in strain suggests that the material reached its deformation limit similarly regardless of orientation, even if the load required to get there differs. As the thickness stayed constant (~6.48–6.51 mm), microstructural rather than geometric factors were evident.
3.3.2. Node Presence: The Paramount Contribution
In contrast, nodes were the most important structural element for improving flexural performance, as clearly shown on
Table 2. Its existence was the most important indicator of material property, with moderate effects on δ and ε and highly substantial effects on
and MOR. In comparison to internodal sections, nodal sections showed a 48.8% higher
and a 61.8% higher MOR. This indicates that the
Oldeania alpina belongs to the category of bamboos most suitable for engineered structural applications because of its exceptionally robust and efficient nodal diaphragms. The widespread belief that nodes serve as diaphragmatic stiffeners that prevent longitudinal splitting and shear failure, which normally control failure in internodal regions under bending
, is supported by this strong reinforcing effect. This implies that nodes function as diaphragms to improve load distribution, buckling prevention and resistance to bending loads. According to
| [10] | X. Wang, S. Yu, S. Deng, R. Xu, Q. Chen, and P. Xu, “Effect of Bamboo Nodes on the Mechanical Properties of Phyllostachys iridescens,” Forests, vol. 15, no. 10. p. 1740, 2024, https://doi.org/10.3390/f15101740 |
| [15] | S.-M. Chen et al., “Mechanically robust bamboo node and its hierarchically fibrous structural design,” Natl. Sci. Rev., vol. 10, no. 2, p. nwac195, Feb. 2023,
https://doi.org/10.1093/nsr/nwac195 |
[10, 15]
, nodes can improve mechanical properties and are essential components for interlaminar shear strength and buckling resistance in designed bamboo products.
The increase in MOR value was considered to be produced by altered cell alignments of the vascular bundles and fiber lengths surrounding the node and internode locations
| [40] | T. Tsuyama, K. Hamai, Y. Kijidani, and J. Sugiyama, “Quantitative morphological transformation of vascular bundles in the culm of moso bamboo (Phyllostachys pubescens),” PLoS One, vol. 18, no. 9, p. e0290732, 2023,
https://doi.org/10.1371/journal.pone.0290732 |
[40]
. A key point of comparison was made with a study by
| [4] | H. R. Scharfenberg et al., “The Flexural Strength of Three Bamboo Species from Brazil: A Comparative Study of Internal and External Lamina Surfaces Using Static and Dynamic Bending Properties,” Forests, vol. 15, no. 4. p. 580, 2024,
https://doi.org/10.3390/f15040580 |
[4]
, which also investigated the influence of knots (nodes) in three bamboo species,
Phyllostachys aurea,
Bambusa tuldoides, and
Dendrocalamus asper, and discovered that the presence of nodes generally increased ultimate strength in some species, supporting the highly significant node effect found. These findings contradicted the findings of
| [41] | V. De Vos, “Bamboo for exterior joinery: A research in material properties and market perspectives,” Van Hall Larenstein University, The Netherlands., 2010. |
[41]
in
P. pubescens bamboo and
G. angustifolia bamboo, as well as
| [42] | E. D. Tomak, E. Topaloglu, N. Ay, and U. C. Yildiz, “Effect of accelerated aging on some physical and mechanical properties of bamboo,” Wood Sci. Technol., vol. 46, no. 5, pp. 905–918, 2012. https://doi.org/10.1007/s00226-011-0454-7 |
[42]
in
P. bambusoides bamboo, which found no differences between the
values of specimens with and without nodes, and the trend in
G. scortechinii bamboo, which showed a lower
value for specimens with nodes
| [43] | H. Hamdan, A. Zaidon, and M. M. Tamizi, “Mechanical Properties and Failure Behaviour of Gigantochloa Scortechinii,” J. Trop. For. Sci., vol. 21, no. 4, pp. 336–344, 2009 |
[43]
. The various trends in the data could be attributed to variances in node structure and size across the bamboo species.
Table 3 displays the MOR and
values of bamboo specimens with and without nodes at various orientations. In comparison to the structural wood and structural bamboo products, this bamboo species was found to have higher MOR and
values than Douglas fir, laminated bamboo lumber and bamboo scrimber
| [9] | B. Sharma, A. Gatoo, M. Bock, H. Mulligan, and M. Ramage, “Engineered bamboo: state of the art,” Proc. Inst. Civ. Eng. Mater., vol. 168, no. 2, pp. 57–67, 2015.
https://doi.org/10.1680/coma.14.00020 |
| [44] | S. Srivaro, “Potential of three sympodial bamboo species naturally growing in Thailand for structural application,” Eur. J. Wood Wood Prod., vol. 76, no. 2, pp. 643–653, 2018, https://doi.org/10.1007/s00107-017-1218-3 |
[9, 44]
.
Notably, nodes caused a considerable increase in failure displacement (13%) and strain (10.2%), despite the fact that they greatly enhanced strength and stiffness. This implies that by encouraging more controlled, ductile failure modes as opposed to brittle fracture, nodes contributed to both strength and toughness, i.e., the energy absorbed prior to failure. Toughness (area under the load-displacement curve) was strongly correlated with the node's influence on raising displacement, particularly at the top, while dramatically boosting strength. This is consistent with
description of the node's function in energy dissipation and fracture deflection.
3.3.3. Longitudinal Location: A Tale of Taper and Biomechanical Optimization
A complex biomechanical technique that strikes a compromise between structural demands and material economy was shown by the performance, which fluctuates rationally along the height of the bamboo culm, reflecting the biological needs of the plant. This pattern reveals two adaptations: a material optimization that peaked in the middle section (highest
and MOR), despite not being the thickest, while the top section was the thinnest (5.58 mm), deflected the most (25.21 mm, δ), and had the lowest strength/stiffness. The geometric taper (thickness decreased from 7.66 mm at the bottom to 5.58 mm at the top) directly governed stiffness and deflection via beam theory. The bottom deflected the least (18.42 mm, δ) and was the thickest (7.66 mm). The middle section's good performance supports findings by
| [45] | van der Lugt, van den Dobbelsteen, and J. J. A. Janssen, “An environmental, economic and practical assessment of bamboo as a building material for supporting structures,” Constr. Build. Mater., vol. 20, no. 9, pp. 648–656, 2006,
https://doi.org/10.1016/j.conbuildmat.2005.02.023 |
[45]
by indicating an optimal material distribution where fiber density and quality peak in the area most likely subjected to the greatest bending moments in a live culm (the mid-span of a cantilever). More compliant apical regions for flexibility, denser basal fibers for robustness and appropriate fiber maturity mid-culm were all in line with this gradient.
| [34] | U. G. K. Wegst, H. Bai, E. Saiz, A. P. Tomsia, and R. O. Ritchie, “Bioinspired structural materials,” Nat. Mater., vol. 14, no. 1, pp. 23–36, 2015, https://doi.org/10.1038/nmat4089 |
[34]
explored biomimetic optimization concepts, which are reflected in this effective design that minimizes material while satisfying mechanical needs.
One well-known adaptation for cantilevered plant stems that reduces weight and increases flexibility is the decrease in thickness from bottom to top. The increase in deflection (δ) in thinner sections under load is immediately explained by it. According to
| [46] | T. Y. Lo, H. Z. Cui, P. W. C. Tang, and H. C. Leung, “Strength analysis of bamboo by microscopic investigation of bamboo fibre,” Constr. Build. Mater., vol. 22, no. 7, pp. 1532–1535, 2008, https://doi.org/10.1016/j.conbuildmat.2007.03.031 |
[46]
, this tapering explains why displacement is most at the top culm. Although the material itself may have lesser strength, the lower moment of inertia in thinner top samples results in more deflection under load. Location mostly influenced deformation-related measures (displacement), although node presence and loading orientation were the most constant influencers across characteristics, according to the ANOVA analysis. Nodal middle OC for high-stiffness beams, internodal top OT for ductile parts, and targeted grading to promote bamboo's sustainability were some of the best configurations for these applications.
3.4. Interactive Effects on Bamboo Flexural Properties
In split bamboo, a lightweight, renewable composite valued for structural applications, stiffness, strength, deformation capacity and material geometry were determined by the interaction of nodes, culm position and orientation. These pairwise combinations showed interaction influences on bending performance. The behavior of split bamboo when natural biological variables interact was examined in detail by this interaction data (
Table 4).
Table 4. The mean flexural properties of interactive effects.
Category | Subcategory | | MOR | P | δ | ε | t |
Loading | OC + Without | 11.80 | 147.16 | 381.88 | 20.11 | 1.29 | 6.79 |
+ | OC + With | 18.29 | 234.26 | 575.69 | 22.49 | 1.34 | 6.23 |
Node | OT + Without | 9.81 | 120.50 | 283.81 | 20.87 | 1.27 | 6.50 |
| OT + With | 13.99 | 199.78 | 501.15 | 23.78 | 1.47 | 6.51 |
| Bottom + Without | 9.94 | 128.27 | 530.14 | 16.60 | 1.30 | 7.65 |
Location | Bottom + With | 15.47 | 216.07 | 822.15 | 19.40 | 1.43 | 7.66 |
+ | Middle + Without | 11.12 | 136.59 | 299.56 | 21.77 | 1.28 | 6.73 |
Node | Middle + With | 18.43 | 234.44 | 435.25 | 23.22 | 1.32 | 5.74 |
| Top + Without | 11.13 | 135.23 | 224.70 | 22.07 | 1.26 | 5.86 |
| Top + With | 13.54 | 190.26 | 227.44 | 29.14 | 1.51 | 5.23 |
| Bottom + OC | 15.23 | 213.97 | 794.50 | 19.40 | 1.42 | 7.54 |
Location | Bottom + OT | 11.84 | 156.71 | 654.40 | 17.44 | 1.35 | 7.78 |
+ | Middle + OC | 16.85 | 203.09 | 422.33 | 21.93 | 1.29 | 6.30 |
Loading | Middle + OT | 14.13 | 184.57 | 343.17 | 23.10 | 1.31 | 6.06 |
| Top + OC | 14.22 | 169.36 | 242.95 | 22.98 | 1.24 | 5.58 |
| Top + OT | 9.68 | 147.60 | 204.63 | 28.00 | 1.53 | 5.58 |
3.4.1. Loading Direction × Node Presence (D × N): The Defining Synergy
Understanding high-performance bamboo requires an understanding of the most striking interplay between loading orientation and node presence, which created an ultra-efficient load path. Performance was continuously improved by nodes, with the biggest improvements occurring in OC configurations where the nodal contribution and outer fiber density maximized compressive resistance: MOR of 234.26 MPa and
of 18.29 GPa. In order to generate an extremely efficient load channel, the node's diaphragm collaborated with the robust outer fibers in compression, demonstrating a true interaction rather than just the sum of the individual advantages. There was a significant boost from “OC + Without Node”: 59% for MOR and 55% for
. This interaction quantified the interaction and validated that the node's architecture was genetically adjusted to maximize performance under natural bending pressures (outer in compression), even though the individual effects are well-known
| [33] | M. K. Habibi and Y. Lu, “Crack propagation in bamboo’s hierarchical cellular structure,” Sci. Rep., vol. 4, no. 1, p. 5598, 2014. |
[33]
.
| [34] | U. G. K. Wegst, H. Bai, E. Saiz, A. P. Tomsia, and R. O. Ritchie, “Bioinspired structural materials,” Nat. Mater., vol. 14, no. 1, pp. 23–36, 2015, https://doi.org/10.1038/nmat4089 |
[34]
highlighted the biomimetic principle of “multifunctional integration” in which biological materials combine aspects to enhance performance.
The weakest condition was “Without Node + OT” (: 9.81 GPa, MOR: 120.50 MPa). As the material was loaded in its weakest orientation and lack nodal contribution, it was suggested that nodes reduced tensile weaknesses while permitting more deformation. In comparison, the strength only reached 199.78 MPa in the “OT + With Node” setup, even if the node continued to be helpful. This is because the outer skin was being forced apart (tension), and instead of acting as contribution, the entangled fibers at the node might occasionally behave as a stress concentrator in tension. Compared to OT loading, the node benefited far more from OC loading. While the node only raised by 4.18 GPa (43%), it raised by 6.49 GPa (55%), in OC. According to this, the architecture of the node has been evolutionarily adjusted to maximize performance in the normal loading scenario (outer in compression).
Notably, “OT + With Node” provided the greatest displacement (23.78 mm) and strain (1.47%), although “OC + With Node” exhibited superior strength and stiffness. This implies that nodes could enhance ductility in one situation and strength in another, promoting distinct failure mechanisms based on orientation. According to
| [19] | E. Obataya, P. Kitin, and H. Yamauchi, “Bending characteristics of bamboo (Phyllostachys pubescens) with respect to its fiber–foam composite structure,” Wood Sci. Technol., vol. 41, pp. 385–400, Jun. 2007,
https://doi.org/10.1007/s00226-007-0127-8 |
| [51] | S. Guan, J. Zhao, L. Tian, S. Zhang, and H. Zhao, “Compressive stress–strain relationships of laminated bamboo under service temperature,” Mater. Struct., vol. 58, no. 1, p. 11, 2024, https://doi.org/10.1617/s11527-024-02515-7 |
[19, 51]
, nodes serve as crack arresters and stress redistributors, minimizing deformation and failure propagation. This is supported by the reported decrease in strain and displacement with nodes during compression
| [38] | X. Li, H. Ye, S. Han, M. Li, H. Lin, and G. Wang, “Effects of bamboo nodes on mechanical properties of thin-type bamboo bundle laminated veneer lumber (BLVL): From anatomical structure to penetration mechanism,” Ind. Crops Prod., vol. 203, p. 117119, 2023.
https://doi.org/10.1016/j.indcrop.2023.117119 |
| [48] | D. Zhang, L. Yan, X. Meng, Y. Y. A. Sewar, Z. Zhang, and Y. Gao, “Mechanical properties of a novel laminated veneer bamboo using curved cross-sectional strips,” Ind. Crops Prod., vol. 220, p. 119290, 2024.
https://doi.org/10.1016/j.indcrop.2024.119290 |
[38, 48]
. Comparative investigations of bamboo flexural responses have shown that the little increase in displacement and strain under tension with nodes may be caused by localized microstructural differences or stress concentrations in internodal regions versus nodes
| [47] | P. Liu, Q. Zhou, F. Fu, and W. Li, “Effect of Bamboo Nodes on the Mechanical Properties of P. edulis (Phyllostachys edulis) Bamboo,” Forests, vol. 12, no. 10, p. 1309, 2021,
https://doi.org/10.3390/f12101309 |
[47]
. A complicated composite material was indicated by the dual behavior, which was ductile in one configuration and stiff in another. This is in line with studies that emphasize the node's function in creating intricate stress fields and boosting toughness through larger deflections that facilitate energy absorption
.
3.4.2. Location × Node Presence (L × N): The Context-Dependent Node
The way location and node presence interact showed how a node’s mechanical function changed depending on where it was on the culm. It's a common misperception that the strongest part is always the thicker bottom half. The analysis disproved this. The node reached its maximum reinforcing potential because to the middle section’s designed material matrix, which produced the highest absolute increases from internodal conditions (+7.31 GPa
, +97.85 MPa MOR). The node significantly increased displacement (+32%) and strain (+21%) in the top part, while providing a comparatively minor increase in
(+2.41 GPa) and MOR (+55 MPa). This suggests that the node’s main function in the thin, weak top changed from supplying maximum strength to improving ductility and damaged tolerance in this susceptible area. It permitted greater, energy-absorbing deformation by preventing brittle fracture. Studies on fracture mechanics, like
, highlight the dual function of nodes, i.e., toughness in some situations and strength in others. They characterize nodes as crack deflectors that enhance fracture resistance. Although the bottom exhibited significant node benefits, its excellent baseline performance was probably mostly due to its huge thickness. The hierarchical optimization theory put forth by
| [34] | U. G. K. Wegst, H. Bai, E. Saiz, A. P. Tomsia, and R. O. Ritchie, “Bioinspired structural materials,” Nat. Mater., vol. 14, no. 1, pp. 23–36, 2015, https://doi.org/10.1038/nmat4089 |
[34]
, in which biological materials strategically distribute contribution according to local stress levels and failure risks, is consistent with this context-dependent functioning.
3.4.3. Location × Loading Orientation (L × D): Geometry Modulates Anisotropy
This interaction demonstrated how the expression of the material anisotropy of the culm was influenced by its shifting geometry. The bottom was where the loading orientation had the biggest impact; OC produced a 43.2% higher
and a 29.6% higher MOR than OT. The potential benefit of compressing the robust outer fibers was maximized by the thick bottom section’s large material volume. Despite having less strength, the OT orientation caused 21.8% more displacement and 23.4% more strain at the top than the OC orientation. This shows an important failure mode insight: in the thin top, a ductile, crushing failure that permitted significant deformations was induced by loading the weak inner core in compression (OT). The OC mode was broken more brittlely and stiffly. The bamboo lost almost all of its stiffness at the base when a thin wall (mm) and the less effective loading orientation (OT) were combined. The middle’s steady but moderate OC loading boost confirmed its reputation as a top-notch, dependable segment. In the bottom and middle, where denser material amplified compressive advantages, OC regularly performed better than OT. The size-dependent mechanical behavior in bamboo that
noticed was reflected in this geometry-modulated anisotropy. They observed that scale effects in the hierarchical structure caused failure mechanisms to alter with specimen dimensions.
Node presence, loading orientation and culm position all have interaction impacts on split bamboo flexural characteristics, according to the interaction means from the three-way ANOVA. The functionally graded structure of bamboo, where nodes offered crucial contribution that interacted with fiber orientation and geometric gradients, was consistent with these patterns. These interactions showed that nodes provide contribution (particularly under compression), middle culm sections offered peak properties because of balanced fibre distribution, and OC orientation took advantage of the material's graded structure to achieve the best flexural performance in split bamboo. Strength significantly decreased in OT/top arrangements or without nodes, although deformation capacity increased, indicating trade-offs between ductility and stiffness. Variations in thickness suggest microstructural roles but only partially explained trends and did not fully account for mechanical benefits. Overall, graded material use for rigidity or energy absorption was encouraged by ideal interaction (e.g., middle + with node + OC), which imply up to ~87% higher /MOR than suboptimal combinations.
3.5. Load-Deflection and Flexural Stress-Strain Behavior of Split Bamboo
The full P-δ and σ-ε response envelopes for bamboo over its whole design space were thoroughly examined in this discussion. The analysis focuses on how these curves' morphology was systematically changed by the important interactions, specifically Node × Loading Orientation, Location × Node and Location × Loading Orientation. These changes represent fundamental shifts in damage mechanisms, failure initiation and fracture propagation.
Figures 4 – 8 offers significant insights into how the morphology of load-deflection (P-δ) and stress-strain (σ-ε) curves was profoundly changed by the combinations of node presence, loading orientation and longitudinal location. For stiffness, higher
resulted in steeper slopes; for strength, higher MOR elevated peaks; for ductility, bigger δ stretched curves horizontally; and for failure strain, ε indicates brittle tendencies notwithstanding absolute δ. The fundamental failure mechanisms and energy dissipation pathways specific to bamboo as a hierarchical natural composite were revealed by these behavioral markers.
3.5.1. Load Deflection Curves
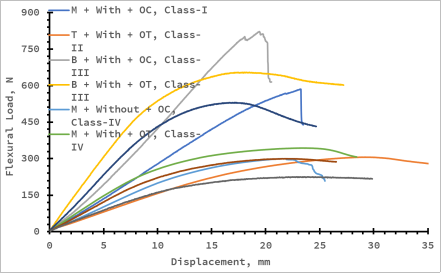
A structural element's total load-deflection (P-δ) response, which includes pre-peak stiffness, yielding behavior, peak load capacity and post-peak softening or failure characteristics, defines its overall mechanical behavior. In addition to strength and stiffness, this complete behavioral envelope also defines ductility, toughness and failure mode—all crucial factors for engineering design, especially in applications that call for energy absorption, damage tolerance or collapse avoidance. The following is how bamboo bends and fails: since the specimen was in an elastic state and its deflection increased linearly with the load at the beginning of loading, the flexural modulus of elasticity may be calculated because the stress-strain curves exhibited a linear relationship. The specimen exhibited a discernible deflection, and its deflection increased nonlinearly as the force increased. The tested bamboo strips' flexural strength was found to be the maximum flexural stress before failure. For every point on the load-deflection trace, the maximum flexural stress and strain at the mid-span outer surface were calculated using the beam theory. Comprehensive mechanical fingerprints that differentiate five basic behavioral groups (classes) were provided by the form, slope, peak features and inferred post-peak behavior.
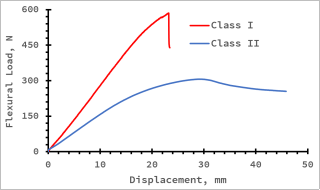
Class I: The Strength-Optimized Configuration
Middle + With Node + OC: This combination had the highest and MOR in the sample. Superior material property was indicated by the P-δ curve's exceptionally steep linear area in relation to thickness. Due to the combined effect of three factors, the location-optimized fiber density, the strong outer fibers positioned in compression where they contribute the most stiffness, and the nodal diaphragm providing shear continuity across the cross-section, the elastic limit was high and the proportional limit was difficult to distinguish from ultimate strength.
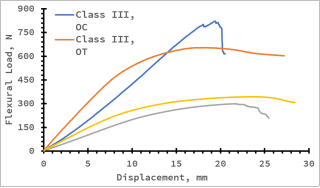
Figure 4. Typical load-displacement curves for fundamental behavioral Class I and II.
Figure 4's linearity suggests excellent composite action and little pre-peak damaged accumulation. Near the peak load, there was a sudden change in behavior from linear to non-linear. A protracted yield plateau did not exist. This suggests that the onset of damage and its progression to critical failure happened almost at the same time. With a single, clearly defined maximum load point, the peak was brittle and identifiable. Given the brittle nature of tensile fiber failure and the mild strain levels (ε = 1.32%), these designs would show a quick descending branch soon after the peak, followed by an abrupt post-peak load decrease of 40–60%. Tensile rupture of the outermost fiber bundles is characterized by this. In their detailed description of this failure process,
| [49] | S. Amada and S. Untao, “Fracture properties of bamboo,” Compos. Part B Eng., vol. 32, no. 5, pp. 451–459, 2001. |
[49]
pointed out that the ultimate limiting factor for flexural capacity in ideal orientation is the tensile strength of bamboo's peripheral fibers. For Moso bamboo under stress, they found comparable strain at failure values (1.2-1.4%).
Class II: The Toughness-Optimized Configuration
Top + With Node + OT:
Figure 4's P-δ curves for this class show a radically different shape. Compared to Class I, the first slope was significantly shallower, indicating less flexural stiffness. This was caused by two things: the top section’s overall thickness (and consequently section modulus) was reduced, and the weak inner parenchyma was now in a compressed position. These curves most notably showed growing non-linearity starting at roughly 50–60% of peak load. The slope steadily declined, suggesting that the compressive zone was continuously accumulating damage. The maximum load was maintained over a range of displacement, and the peak was noticeably rounded rather than abrupt. This suggests that load transfer from failed to undamaged regions occurred during a sequential failure phase as opposed to a simultaneous one. Given the ductile nature of compressive cellular collapse and the high failure strain (ε = 1.47-1.52%), these configurations showed a slow softening tail that extends to displacements well beyond the peak. As the crushed parenchyma zone gradually extended and densified, the load gradually degraded. According to
| [34] | U. G. K. Wegst, H. Bai, E. Saiz, A. P. Tomsia, and R. O. Ritchie, “Bioinspired structural materials,” Nat. Mater., vol. 14, no. 1, pp. 23–36, 2015, https://doi.org/10.1038/nmat4089 |
[34]
, this is referred to as ductile compressive failure of the functionally graded core, with nodes acting as crucial barriers that prevent cracks. Nodes in bamboo sections with thin walls function as crack-deflecting interfaces to increase fracture toughness by encouraging non-catastrophic failure modes, according to
.
Class III: The Geometrically-Dominated Configuration
Bottom + With Node + Any Orientation: Despite relatively minimal displacement, the P-δ curve in
Figure 5 demonstrated very strong rigidity and the largest peak load of any arrangement. The thickness of the bottom segment (t = 7.66 mm) was 24.15% greater than that of the middle section (6.17 mm) and 37.3% greater than that of the top section (5.58 mm), demonstrating that this impact was entirely geometric. Although the geometric constraint restricted the overall amount of deformation that can occur, the loading orientation determined which constituent fails (outside fibers in tension vs. inner core in compression) and, consequently, the peak stress. This shows that when determining deformation capacity, geometry can take precedence over material anisotropy. In keeping with the various failure mechanisms, the OC orientation yielded a sharper peak than the OT orientation. Because the thicker portion provided more stable fracture propagation, the post-peak behavior was probably more controllable than Class I, even with the high load capacity. Compared to OC, the OT orientation would show a more progressive post-peak tail due to its compressive failure mechanism.
Figure 5. Typical load-displacement curves for fundamental behavioral Class III and IV.
The plant's investment in geometric reinforcement, which thickens the wall to withstand significant bending forces at the base, was represented by the bottom part. Because material volume scales linearly with t and moment capacity scales with t² (for section modulus), this approach is mechanically efficient. Limited ductility and decreased flexibility were the trade-offs. According to
, wall thickness accounts for 70–80% of the variance in flexural tests, making it the single best predictor of bamboo's load-bearing capacity. The theoretical cubic relationship between thickness and moment capacity is supported by our data, which shows that bottom sections may attain 1.8× the load capacity of middle sections with only 1.2× the thickness.
Class IV: The Balanced Performer
Middle + With Node + OT | Middle + Without Node + OC: According to
Figure 5, these curves depicted intermediate behavior between the extremes: a moderately sloping initial linear region that reflects the middle section's excellent material properties but limited thickness; a gradual, progressive non-linearity that starts at 60–70% of peak load; a moderately rounded peak that was well-defined and strikes a balance between the Class I brittle drop and the Class II gradual softening as shown in
Figure 7.
By concentrating premium fibres in the area of greatest bending stress, the middle portion reflected the plant’s effort in material optimization. Throughout the whole culm, this method yielded the maximum particular stiffness and specific strength (properties per unit weight). The most accommodating area was the middle region, which produced decent results even when node presence or orientation was less than ideal. With only minor variations, both combinations exhibited outstanding performance. While the OT curve had a little greater displacement, the OC curve was more robust and stiffer. Both display significant peaks and well-defined linear sections. This approach, in which material properties are graded throughout the length to fit the stress distribution, was recognized by
| [38] | X. Li, H. Ye, S. Han, M. Li, H. Lin, and G. Wang, “Effects of bamboo nodes on mechanical properties of thin-type bamboo bundle laminated veneer lumber (BLVL): From anatomical structure to penetration mechanism,” Ind. Crops Prod., vol. 203, p. 117119, 2023.
https://doi.org/10.1016/j.indcrop.2023.117119 |
[38]
, as a feature of biological materials optimized for flexure. This principle is quantitatively confirmed.
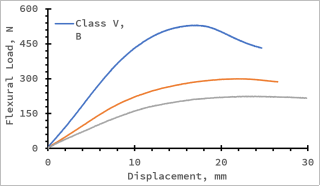
Figure 6. Typical Load-displacement curves for fundamental behavioral Class V.
Class V: The Performance-Limited Configuration
Any Location + Without Node + Any Orientation: These curves have a lower slope than their nodal counterparts, which suggests that the node played a major role in initial stiffness even prior to peak load (
Figure 6). The most important characteristic was well-established from a literature: internodal sections are particularly vulnerable to longitudinal splitting, a devastating shear failure that spreads down the fiber direction and frequently occurs at loads significantly lower than the theoretical flexural capacity. The load intermittently decreased abruptly due to premature splitting before achieving full flexural capacity, and the peak was often inconsistent and vaguely delineated. Despite similar displacement values, the area under the curve was significantly lower, suggesting poor toughness.
The specimen lacked a crucial component that prevents longitudinal fracture development and interlaminar shear failure in the absence of nodal contribution. The crucial diaphragm that typically guards against these failure types was eliminated when the node was absent. According to
| [14] | Z. P. Shao, C. H. Fang, S. X. Huang, and G. L. Tian, “Tensile properties of Moso bamboo (Phyllostachys pubescens) and its components with respect to its fiber-reinforced composite structure,” Wood Sci. Technol., vol. 44, no. 4, pp. 655–666, 2010, https://doi.org/10.1007/s00226-009-0290-1 |
| [47] | P. Liu, Q. Zhou, F. Fu, and W. Li, “Effect of Bamboo Nodes on the Mechanical Properties of P. edulis (Phyllostachys edulis) Bamboo,” Forests, vol. 12, no. 10, p. 1309, 2021,
https://doi.org/10.3390/f12101309 |
[14, 47]
, nodes are specifically necessary to stop shear failure in bamboo, and structural bamboo should always have nodes at crucial shear zones. This suggestion was supported by the results, which showed that even the thick bottom section only attains 68% of its nodal counterpart's MOR in the absence of the node (128.27 vs. 216.07 MPa).
Figure 7. Typical Load-displacement curves for all fundamental behavioral classes.
3.5.2. Flexural Stress Strain Behaviour
The materials-engineering study of the stress-strain behavior and failure characteristics of the split bamboo specimens under outer compression or outer tension showed the crucial influence of node presence, longitudinal locations and loading orientation on the bending performance. The stress-strain (σ-ε) curves demonstrate the inherent constitutive behavior of bamboo, which was unaffected by size effects.
a) The Constitutive Signature of Tensile Fiber Rupture
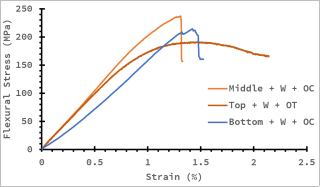
Middle + With + OC | Bottom + With + OC: This curve shows a sharp and well-defined maximum stress, rapid stress decay, an abrupt transition zone where slight non-linearity arises due to localized damage, and a perfectly linear from origin to around 80% of peak stress. As seen in
Figure 8, the curve drops practically vertically. When the reinforcing phase (fibres) of brittle fiber-reinforced composites failed at a lower strain than the matrix, this signature is typical. Until the fibres reached their ultimate tensile strain, which caused catastrophic rupture, the stress-strain response was dominated by their elastic nature. Excellent fiber-matrix bonding and load transfer were shown by the low non-linearity before the peak. This behavior is characteristic of natural fibre composites with a high fibre volume fraction and strong interfacial bonding, according to
. Bamboo differs from ductile materials like steel and is comparable to other high-performance natural fibres like flax and hemp due to the lack of a yield plateau.
Figure 8. Typical stress strain curves for tensile fiber rupture and compressive core crushing.
b) The Constitutive Signature of Compressive Core Crushing
Top + With + OT: A linear region with a moderate slope, an early departure from linearity at 50–60% of peak stress, a broad, rounded peak region where stress was sustained over a wide strain range, and a gradual, progressive stress decay with an extended tail were all features of the curve shown in
Figure 8. Cellular materials going through compressive collapse have this hallmark
| [51] | S. Guan, J. Zhao, L. Tian, S. Zhang, and H. Zhao, “Compressive stress–strain relationships of laminated bamboo under service temperature,” Mater. Struct., vol. 58, no. 1, p. 11, 2024, https://doi.org/10.1617/s11527-024-02515-7 |
[51]
. The parenchyma cell walls' elastic bending was represented by the first linear section. The beginning of elastic buckling of cell walls was correlated with the yield point. The plateau area was associated with increasing densification and cell collapse. Fibre bridging and post-peak load redistribution were represented by the longer softening tail. Theoretically, this behavior was explained by
, who showed that the relative density and cell wall characteristics of the cellular material control the compressive stress-strain response of cellular solids. In-situ microscopy was used by
| [33] | M. K. Habibi and Y. Lu, “Crack propagation in bamboo’s hierarchical cellular structure,” Sci. Rep., vol. 4, no. 1, p. 5598, 2014. |
[33]
to directly examine this progressive crushing mechanism, recording the successive bending of parenchyma cell rows from the compressive face inward.





 Share This Article
 Twitter
 Linked In
 Facebook
 Copy
Copy Download