Research Article | | Peer-Reviewed

Investigation of Polychlorinated Biphenyls (PCB) on Sediments in Selected Artisanal Crude Oil Refining Sites in Niger Delta

Received: 19 June 2025     Accepted: 4 July 2025     Published: 4 August 2025
Views:       Downloads:
Abstract

The concentration level of 15 PCB congeners and associated risk to the ecosystem were investigated in sediments around local crude oil refining sites in the Niger Delta region of Nigeria. The gas Chromatography-Mass spectrometry (Agilent 8082A USEPA) method was applied for the identification and quantification of PCBs in sediments from four sites around the Niger Delta. The ∑15 PCB concentration level in sediments ranged from <1 (PCB 209) to (PCB 203) 185 ug/kg for SSL1(Ebean Lake) sediment sample, (PCB 201) 4.52 ug/kg to (PCB 183) 824 ug/kg for SSL2 (Forcados river) sediment sample, (PCB 203 and PCB 209) <1 ug/kg to (PCB 183) 120.1 ug/kg for SSL3 (Urashi River) sediment sample, and (PCB 209) <1 ug/kg to (PCB 153) 67.53 ug/kg for SSL4 (Choba River) sediment sample elevated concentration level of PCB were found in the forcados river of Bayelsa state. Mean levels of ∑15 PCBs in sediment samples from the four sampling stations ranged from 5.31 ug/kg (PCB201) to 158.6 ug/kg (PCB 209). PCB concentration level in each sampling location was higher than the interim sediment quality Guidelines (ISQG). The risk/danger PCBs pose to the environment was evaluated and calculated using the potential ecological risk index, and recommendations for mitigation and management strategies were provided.

Published in Journal of Energy, Environmental & Chemical Engineering (Volume 10, Issue 3)
DOI 10.11648/j.jeece.20251003.11
Page(s) 78-91
Creative Commons

This is an Open Access article, distributed under the terms of the Creative Commons Attribution 4.0 International License (http://creativecommons.org/licenses/by/4.0/), which permits unrestricted use, distribution and reproduction in any medium or format, provided the original work is properly cited.

Copyright

Copyright © The Author(s), 2025. Published by Science Publishing Group

Keywords

Polychlorinated Biphenyls (PCBs), Congeners, Ecological risk, Toxicity, Concentration

1. Introduction
Polychlorinated biphenyls (PCBs) are a classical group of persistent organic pollutants (POPs) that have been extensively used worldwide since they were first produced, in 1930. Owing to their physical-chemical characteristics, PCBs were mostly utilized in paints, plasticizers, carbonless copy paper, and electric fluids in transformers and capacitors. They were also used to a lesser extent, as hydraulic lubricants, and flame retardants . Polychlorinated biphenyls (PCBs) are a class of synthetic organic compounds that became widely used in industry during the twentieth century. They were initially thought to be novel and versatile, but due to their exceptional stability, electrical insulating characteristics, and non-flammability, they were used in a variety of products. However, the negative environmental and health effects of PCBs were discovered over time, leading to its global ban. Despite major regulation efforts, PCBs continue to pose serious environmental and human health risks.
Polychlorinated biphenyls (PCBs) are highly carcinogenic chemical compounds, formerly used in industrial and consumer products, whose production was banned in the United States by the Toxic Substance Control Act in 1979 and internationally by the Stockholm Convention on Persistent Organic Pollutants in 2001. They are organic chlorine compounds with the chemical formula C12H10−xClx. Chlorine atoms partially replace some of the hydrogen atoms in biphenyl in PCBs. In 209 chemical compounds, hydrogen atoms can be substituted by one to 10 chlorine atoms. These are manmade chemicals, they can be oily or solids, clear to yellow, with no smell or taste. PCBs are persistent organic pollutants because they continue to exist in the environment, and they resist degradation. Because of their longevity, PCBs are still widely in use, even though their manufacture has declined drastically since the 1960s when their environmental toxicity was identified and classified as persistent organic pollutants (POP). They are capable of exhibiting ecotoxicity effects far away from their point of emission due to their ability to undergo long-distance migration and have the capacity to bioaccumulate in organs and tissues of organisms and magnify through the food chain .
The PCB load in the environment comes through atmospheric circulation and deposition, as well as discharges from anthropogenic processes such as waste incineration, effluents from industrial processes, leaks from electrical transformers containing PCBs, oil leaks and surface runoffs, and disposal of PCB-containing consumer products .
1.1. Air Transport
PCBs can be transported over long distances through the atmosphere. They can attach to fine particles and travel with wind currents, leading to their deposition in remote areas far from their sources. PCBs can also undergo re-volatilization from surfaces and be re-emitted into the air, contributing to their ongoing transport.
1.2. Water Transport
PCBs can be transported via water bodies such as rivers, lakes, and oceans. They can dissolve in water to some extent, but they tend to bind to suspended particles and organic matter. This association with particles allows PCBs to be transported downstream, where they may settle or be deposited in sediment.
1.3. Bioaccumulation and Biomagnification
PCBs tend to accumulate in organisms through the food chain. When aquatic organisms, such as small fish or invertebrates, consume PCB-contaminated particles or prey on other contaminated organisms, the PCBs can accumulate in their tissues. These contaminated organisms can then be consumed by larger predators, leading to the biomagnification of PCBs at higher trophic levels.
1.4. Terrestrial Transport
PCBs can also be transported through soil and vegetation. They may adhere to soil particles, and their movement can occur through erosion or runoff. PCBs can be taken up by plants and subsequently enter the food chain through consumption by herbivores or omnivores.
1.5. Global Transport
Due to their ability to undergo long-range transport, PCBs have been detected in remote regions, including areas far from their sources. They have been found in the Arctic, for example, where they have been transported through atmospheric and oceanic currents.
1.6. Sediment Transport
PCBs that enter water bodies can settle and accumulate in sediment over time. Sediments can act as long-term reservoirs of PCBs, and they can serve as a source for recontamination of water and biota.
The environmental transport of PCBs contributes to their widespread distribution. These transport mechanisms emphasize the need for continued efforts to mitigate and control PCB contamination at their sources to prevent further environmental and human exposure.
2. Literature Review
Polychlorinated biphenyls (PCBs) are synthetic chlorinated organic chemicals. They are frequently found in the air, water, sediments, and soils and are persistent and pervasive in the environment. Additionally, they build up from aquatic species to fish to people via the food chain. PCBs are intricate blends of distinct chlorophenyls. PCBs are suitable for many industrial uses because of their great chemical stability and low reactivity; nevertheless, the same properties that make many individual chlorophenyls useful for industry also make them more persistent and less desirable for the environment than many other organic chemicals.
Concern over the trace levels of highly chlorinated organic chemicals (such as dioxins, PCBs, and certain pesticides) in various environmental media (air, soil, water, and biota) has grown over a period of time. Such halogenated organic compounds enter the food chain from environmental media, mainly through the intake of animal or fish fats (meat, fish, and milk), and reach humans and wildlife .
Søren Jensen issued the first alert about PCBs becoming omnipresent in the environment. While researching DDT (dichlorodiphenyltrichloroethane) in 1966, Jensen happened to accidentally find unidentified compounds in the muscle of Swedish white-tailed sea eagles. The levels were appreciably higher in the fish-eating sea eagles than in fish collected from the same areas. So, he concluded that the molecules must be persistent in living tissues and not easily broken down. The mystery chemicals were extremely resistant to degradation, being unaffected even when boiled in concentrated sulphuric acid. It took two further years of study for Jensen to be able to demonstrate that they were PCBs. Søren Jensen reported his research in 1969, revealing a significant amount of the Baltic Sea fauna had extraordinarily high PCB concentrations . PCBs had entered the environment in large quantities for more than 37 years and were bioaccumulating along the food chain.
The body of information demonstrating PCBs' pervasiveness as environmental toxins grew during the 1970s. In isolated places like the Arctic, PCBs have been discovered. The Rhine River was discovered to be a major source of PCB pollution in the Netherlands. Measured inputs at Lobith, near the German border, from 1976 to 1981 varied from 14,300 kg to 24,000 kg. Since the majority of PCBs were suspended in fine silt, the concentrations in the sediments were highest in areas where river flow rates were low. The sediments in Rotterdam harbor had the highest concentrations — 12-24 mg/kg. As these sediments were used for reclaimed land, this resulted in the Netherlands being contaminated at the rate of 5000 kg of PCBs a year. Fatty fish caught off the Dutch coast were highly polluted. Eels from the rivers and lakes, tested in 1977 and 1988, contained 3.0-131 mg/kg of PCBs . Studies involving PCBs in fish, mink, seabirds, and humans further demonstrated the bioaccumulation of PCBs. Evidence of actual or suspected harm caused by their bioaccumulation was also documented. What also became clearer throughout the 1970s was an understanding of the major reason for the disagreement between those who said PCBs were harmful in low quantities and those who said they were not. It was found that different forms — 'congeners' — of PCBs have different numbers and positions of chlorine atoms that determine the molecule's physical and chemical properties. Studies in the late 1970s recognized the significance of these different congeners, although at first the differences were wrongly attributed solely to the level of chlorination. This proved too simplistic, and after confusing the debate for a while it became evident that both the position and numbers of the chlorine atoms influenced toxicity, and that different congeners have different effects .
PCBs are poisonous to both people and animals. They have been linked to a variety of health impacts, such as skin diseases, problems with reproduction, developmental issues, and some cancer types. The immunological, endocrine, and neurological systems can all be impacted by PCBs. Their concentrations increase as you move up the food chain, with larger concentrations seen in organisms. As a result, significant quantities of PCBs can be ingested by apex predators, such as humans. Many nations have prohibited or severely restricted the production and use of PCBs due to the dangers they pose. For instance, in 1979, the United States outlawed the production of PCBs. Legacy contamination is still a concern, though. The longevity of PCBs and their negative consequences have prompted major cleanup operations in affected areas. In these efforts, toxic soil, sediment, and water are frequently removed or contained. Even though the production of PCBs has been outlawed or drastically decreased in many nations, eating contaminated fish and other foods can still expose people to them. Older structures made of PCB-containing materials may also leak toxic toxins into the air inside. A lot of places still place a high focus on addressing PCB pollution because of the dangers they present to both human health and the environment. To decrease exposure, strategies include enforcing stringent laws about PCB production and disposal, monitoring PCB concentrations in food and the environment, and cleaning up polluted sites.
2.1. PCBs in the Environment
PCBs do not readily break down once in the environment. They can stay and cycle through soil, water, and air for extended periods of time. Long-distance transport is possible for PCBs, which have been discovered in snow and saltwater far from their original environmental release sites. Consequently, they are found all over the world. PCBs can be moved farther from the source of contamination the lighter their form. The leaves and other above-ground sections of plants, including food crops, can absorb PCBs. Additionally, they are absorbed by fish and other tiny organisms. Consequently, eating fish can expose individuals to PCBs that have bioaccumulated in the fish they are consuming. Waste incineration is another possible source of PCBs, however leakage from PCBs incorporating electrical capacitors and transformers is thought to be the main cause of PCBs in the environment. From the available literature, it is evident that PCBs may enter practically into all ecosystems and sustain for years without undergoing biodegradation, oxidation or reduction to any considerable extent . Furthermore, because of their hydrophobic nature, PCBs are largely resistant to degradation by acids, bases, and heat. Furthermore, PCBs can bind with lipid segments in animal tissues and concentrate in animals along the food chain due to their high solubility in lipids. Therefore, food is the main way that people are exposed to PCBs, particularly through meat, fish, and dairy products. In addition to their harmful impacts, a number of PCB breakdown products show even greater toxicity.
2.2. Pathways of Entry into the Environment
The widespread use of PCBs in different commercial and industrial applications along with their inappropriate disposal has created severe environmental contamination. Since landfills might not be built especially to manage hazardous PCB waste, electrical components like capacitors and transformers, along with other PCB garbage from them, are released into the atmosphere. The burning of municipal garbage has the potential to produce hazardous byproducts such as hydrogen chloride (HCl) and PCDD/Fs, which could further increase pollution. Nevertheless, PCBs can also find their way into the environment through the evaporation of paints, coatings, and plastics; direct leaks into sewers and streams; and disposal in unsecure landfills, which can be followed by additional methods such as ocean dumping. A small number of PCBs are being illegally disposed of due to carelessness or ignorance, notwithstanding the rules. In addition to the aforementioned, unintentional spills and leaks are secondary sources that contribute to the worldwide PCB contamination to a lesser level. First, PCBs were recognized in 1966 during the quantification of DDT and its substances in the environmental samples . Subsequently, PCBs have developed into widespread contaminants in the world's ecosystems and are frequently found in the following: milk, fish, plants, animals, adipose tissues from humans, soil, sediments, water, and air. Surprisingly, PCB residues have been noticed in regions of no industrial activity including snow deposits in the Antarctic .
As in the case of most industrial chemicals, loss figures for PCBs are practically non-existent. Possible routes into the environment include leaks from sealed transformers and heat exchangers, leaks of PCB-containing fluids from hydraulic systems which are only partially sealed, spills and losses in the manufacturing either of PCBs or PCB-containing fluids, vaporization or leaching from PCB-containing formulations, disposal of waste PCBs or PCB-containing fluids. Examples of losses by each of these proposed routes include leaks from faulty heat exchangers, and contaminated chicken feed (Holly Farms) incidents; leakage of hydraulic fluid from an air compressor in Escambia Bay, Florida; the indirect evidence of possible losses during manufacture provided by the high level of PCBs in catfish in waters near Anniston, one of the two sites at which PCBs are manufactured in the U. S; the leaching of PCBs from silos by mileage, and the use of waste electrical insulator containing PCBs as a solvent in herbicide treatment of power rights-of-way near Martinsburg, West Virginia. Another unreported disposal of scrap undoubtedly occurs in sewers . Statistical information on such losses is not available but could be generated by an accounting of PCB inventories and disposal by major users. To meet the problem of scrap disposal, Monsanto has set up a disposal system with a capacity of 10 million pounds per year 'for their customers. Within a year of the announcement of the service, 500,000 pounds of waste PCBs had accumulated at the disposal site, where it was held in storage, pending the completion of an incinerator
The total rate of loss of PCBs is thus estimated to have been of the order of 1.5 to 2 X 10³ tons/year into the atmosphere, 4 to 5 X 10³ tons/year into fresh and coastal waters, and 1.8 X 10⁴ tons/year into dumps and landfills. The input into soils via the use of Aroclors as pesticide extenders is believed to have been small, less than 10 tons/year, based on reports of purchases for this purpose. The unauthorized and unrecorded use of scrap PCBs as pesticide extenders is difficult to estimate but has probably been small. Direct discharge into the oceans, e.g. by dumping of hydraulic fluids and lubricants from ships, has probably been of relatively small magnitude but may have been locally significant. Most of the PCBs discharged into the atmosphere will have been Aroclor 1248 to 1260 vaporized from plastic resins, augmented primarily by 1242 vaporized from burning dumps. The discharge into waters will be heavily weighted by the Aroclors used as hydraulic fluids and lubricants and is therefore likely to have included a mixture of Aroclors 1242 to 1260. The residual in dumps will have a large fraction of the Aroclor 1242 production . PCBs are among the most common and pervasive environmental toxins because of their chemical stability, which makes them environmentally persistent. When these undesirable features are combined with the low water solubility of PCBs, great concern emerges, because these substances may be (and are) accumulated through the food chain and reach aquatic organisms, fish, and humans. Nonetheless, it has been found that PCBs can dehalogenate in freshwater and estuary sediments, which has piqued curiosity
According to who investigated the concentrations of polychlorinated biphenyls (PCBs) in sediment samples from the New Calabar River in the Niger Delta Region of Nigeria. Grab sediment samples were collected from five stations in the river and analyzed for individual PCB congeners using gas chromatography - mass spectrometer. The ∑8PCB (sum of eight congeners) identified in the samples ranged from 0.21 to 2.16 mg/kg. Unyimadu monitored the occurrence and distribution of PCBs in the environment. They assessed the occurrence, distribution and composition profiles of PCBs in River Niger, Nigeria. Surface and bottom water samples were collected in consecutive quarters for a period of 2 years, covering the beginning and end of the rainy seasons and the dry seasons, from five locations (Gurara, Lokoja, Onitsha, Brass and Nicolas) along River Niger. It was discovered that the higher molecular weight marker PCBs (∑CB 138, 153 and 180) were more dominant than the lighter homologues (∑CB 28, 52 and 101), while commercial sources Co-PCBs (80.8 ± 61.7 to 288.3 ± 102.0 ng L-1) were more dominant than the incineration sources (34.9 ± 3.82 to 75.5 ± 65.2 ng L-1). Aganbia also determined the concentrations and risks of polychlorinated biphenyls (PCBs) in transformer oils and the environment of a power plant in the Niger Delta, Nigeria. The concentrations of Ʃ14 PCBs were determined, in transformer/turbine oils, soils, groundwater, and drainage water collected within a power plant in the Niger Delta of Nigeria. The Σ14 PCB concentrations in the transformer oils were above the provisional definition of low persistent organic pollutant (POP) content for PCBs of 50 mg kg−1 as identified in the guidelines on the management of POP waste of the Basel Convention. The concentrations of Ʃ14 PCBs in the soils were above the Dutch guideline value of 1000 μg kg−1. Irerhievwie conducted an experiment on spatial characteristics and sources of polychlorinated biphenyls in sediments from some river systems in the Niger Delta, Nigeria. Polychlorinated biphenyls (PCBs) were quantified in sediments from the lower reaches of the Niger, Ase and Forcados Rivers in Nigeria with the aim of elucidating the sources and spatial characteristics. A total of 28 PCB congeners, including 7 indicator PCBs and 12 dioxin-like PCBs, were identified and quantified. Another study was carried out by to determine the concentrations of 28 polychlorinated biphenyls (PCBs) were in soils collected at three depths from thirteen different sites along the floodplain of the lower reaches of the River Niger (LRRN) in Nigeria. The results obtained were used to evaluate the ecological and human health risks, which indicated that there is a potential risk to organisms and humans from exposure to PCBs in these soil profiles. Iniaghe and Enyohwo Kpomah, investigated Polychlorinated biphenyls (PCBs) in water and sediments from the Udu River, Niger Delta, Nigeria. Five surface water and sediment samples were collected from five different points along the course of the Udu River, Niger Delta, Nigeria, which were near the human population. The results show that only PCB-167 was present in surface water, with concentrations greater than the guideline value at one of the sampling points. For sediment samples, all determined concentrations were low relative to established guideline values. A study performed by investigated the concentration of Polychlorinated Biphenyl (PCBs) around a university environment. The study further assessed the risk assessment associated with human contact with the soil using health indexes such as Hazard Quotient (HQ) and Incremental Life Cancer Risk (ILCR) from human unconscious ingestion, inhalation, and dermal contact with the contaminated soil. Soil samples were obtained at different location in Afe Babalola University and analyzed for PCBs.
3. Materials and Methods
3.1. Study Area Description
The chosen study's study area is Nigeria's Niger Delta region. It is situated in the southern region of Nigeria, spanning over 75,000 square kilometres between latitudes 4° N and 7° N and longitudes 5° E to 8° E. With the third largest mangrove forest in the world, the area is a sizable arcuate delta. Nigeria is the sixth largest crude oil exporter in the world, with reserves of about 37.4 billion barrels located in the Niger Delta. Nonetheless, the area is among the most environmentally degraded in the world due to the actions of unconventional crude oil refiners, as well as oil exploration and exploitation, which have catastrophic effects on the ecosystem and negatively damage human health. This study focuses on the sustained impact of the activities of local crude oil refiners on their host communities in the Niger Delta region .
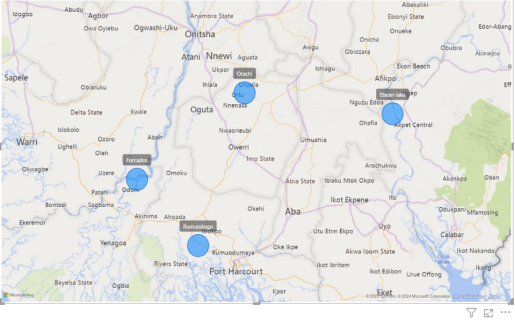
Figure 1. Map of study area showing sample locations.
3.2. Description of Sample Locations (States)
3.2.1. Abia (Ebean Lake)
Ebean lake is located in Abia State is in the southeastern part of Nigeria. The geographic coordinates are approximately; Latitude: 5.6867° N, Longitude: 7.9756° E. It is a serene fresh water lake surrounded by lush vegetation and scenic landscape. It serves as a vital source for nearby communities and supports diverse aquatic life.
3.2.2. Bayelsa (Forcados River)
Forcados river is located in Bayelsa state, which is situated in the central part of the Niger Delta. The geographical coordinates are approximately; Latitude: 5.305°N, Longitude: 6.416665°E. This is a prominent river characterized by its expensive delta and rich biodiversity. It flows through the heart of Niger delta region, winding its way through mangrove forests and wetlands before emptying into the Gulf of Guinea.
3.2.3. Imo (Orashi River)
Orashi river is located in Imo State, which is situated in the southeastern part of Nigeria. It is a picturesque waterway winding through the scenic landscape of southeastern Nigeria. The geographical coordinates are approximately; Latitude: 5.8089° N, Longitude: 7.0731° E.
3.2.4. Rivers (Rumuodogo)
Rumuodogo is located in Rivers State which is situated in the Niger Delta region. Its geographic coordinates include; Latitude: 4.9187061° N, Longitude: 6.7895574° E. It is located in Emuoha Rivers state Port Harcourt, Nigeria.
3.3. Selection Criteria for Sampling Sites
1) Sampling sites were selected near local crude oil refining activities to capture the immediate impact of these operations on sediment contamination.
2) Sites with a documented history of spills or contamination incidents were considered, as these areas are likely to have higher PCB concentrations.
3) Sites located near rivers, estuaries, or other water bodies were included, to evaluate the potential transport of PCBs from sediments to aquatic environments.
4) Sites that represent different geographic locations within the Niger Delta region were selected, to account for potential regional variations in refining practices and environmental conditions.
5) It was ensured that any relevant regulatory guidelines or restrictions were adhered to when choosing sampling sites, ensuring compliance with environmental protection standards.
6) Land use patterns around the refining sites, including industrial, residential, and agricultural areas were considered, to assess the potential impact of PCB contamination on different land uses.
3.4. Sediment Sampling
Sediment samples were collected from four sampling sites in the Niger Delta region of Nigeria, on the 15th of September 2023. The sampling sites were chosen randomly to represent the entire Niger Delta region. Sediments were collected from Four water bodies in different states, in the proximity of an artisanal refinery. The sediment samples were collected with a hand trowel at a depth range of 0-2 m and then put into a sampling bottle for analysis. This sampling was done during the morning hours (9-11 am). Sampling location was chosen at four states namely, Abia, Bayelsa, Imo and Rivers state.
3.4.1. Precautions Taken
To avoid cross-contamination, care was taken to make sure that all sample tools, such as sediment cores and containers, were completely cleansed and rinsed with the proper solvents before use. Disposable gloves and other suitable protective gear were worn to reduce the possibility of contamination on the person and contamination spreading to the sediment samples that were collected. The equipment used for sampling was meticulously cleaned in between each location to avoid any inadvertent contamination transmission from one site to another. To prevent misunderstandings during collection and transportation, sample containers were labelled precisely and legibly. The sample procedure was kept up to date with thorough documentation.
3.4.2. Sample Preservation
Samples obtained were placed in a box containing ice and then transferred to a fridge which serves as a means of preservation until sample preparation for extraction. This was done to prevent sample contamination or degradation during transport.
3.5. Laboratory Analysis
PCB Stock Standard Solution and High purity solvents such as; Methylene Chloride (HPLC), Anhydrous sodium sulphate, Cartridge with silica gel, were used for all analysis, cleaning, and sample procedures.
Ten grams (10 g) of the homogenized sample was put into an extraction bottle, and twenty milliliters (20 ml) of methylene chloride was then added to the sample. This mixture was placed in an orbital shaker and shaken for 30 minutes. The extract was filtered through a glass funnel with glass wool and anhydrous sodium sulphate. The filtrate is then passed through an acidified silica clean-up cartridge and rinsed through the methylene chloride. The cleaned extract is then concentrated to one mil (1 ml). The sample is then transferred to a Teflon-lined screw-cap. The sample was later ready for PCB analysis using a GC-MS, after storing in a refrigerator at 4°C for a while.
3.5.1. Apparatus & Equipment
1) GC-MS (Agilent 8082A), Chem station software
2) 2 ml Screw Cap Vials
3) Glassware
3.5.2. Instrumental Analysis
Gas chromatography equipped with mass spectrometry (GC-MS) was employed to identify and quantify specific PCB congeners present. The vaporizer inlet's configurable temperature was in splitless mode. By comparing the recorded mass spectra and retention times of the compounds eluting from the GC column to reference spectra and retention durations stored in a database, the compounds were identified. The GC-MS was calibrated using the WHO USEPA 8082A analytical standard, (AccuStandard, C-WNN) containing 28 PCBs (8, 18, 28, 52, 44, 60, 77, 81, 101, 105, 114, 118, 123, 126, 128, 138, 153, 156, 157, 167, 169, 170, 180, 187, 189, 195, 206, and 209) was used as the calibration standard.
3.5.3. Quality Assurance/Quality Control (QA/QC) of Sediment Samples
Initial GC-MS accuracy and precision demonstrations, ongoing calibration checks, and routine analysis of laboratory blanks were all part of the QA/QC evaluations.
Additionally, before introducing the samples, MS autotune was done each day. After five-point calibrations, each PCB congener's r2 value was greater than 0.99. To ascertain potential background contamination in the system, laboratory blanks were created, and the samples were blank-corrected.
3.6. Levels of PCB Concentration
Laboratory analysis was used to determine polychlorinated biphenyls concentration levels in sediment samples. A gas chromatography-mass spectrometry chromatogram was used to determine individual congener levels in samples.
In addition to experimental analysis, mathematical descriptive analysis (mean, median, standard deviation) was also used to determine congener levels in the sediment sample. Microsoft Excel, and all statistical analyses were carried out at the significant level of p = 0.05.
3.7. Ecological Risk Assessment
Two methods were used to assess the ecotoxicological risk of PCBs in sediments from the Niger Delta region: the sediment quality guidelines (SQGs) and the potential ecological risk index (PERI) procedure, which was first introduced by . The SQG is a method for evaluating the sediment environmental quality standard in Canada that yields the probable effect level (PEL) and interim sediment quality/guidelines values (ISQG). It is safe for organisms to be exposed to PCBs at concentrations below the ISQG (ISQG = 25.1 ng∙g−1), as PCB exposure seldom has detrimental biological effects. When PCB concentrations are between the ISQG and PEL (PEL = 189 ng∙g−1), PCB exposure to organisms is a threat and may lead to negative biological effects. When PCB concentrations are above the PEL, PCBs pose a serious threat to the exposure of organisms, and the potential for negative biological effects is high. Eq. (1) provides the PCB mean PERI in sediments from the Niger Delta region. To assess the ecotoxicity risk of PCBs in sediments, some researchers have used the PERI technique .
PERI=i=1nEir(1)
WhereEir=TfixCif,andCif=Cis/Cir(2)
Cis = Sample concentration of PCB respectively
Cir = Background of total PCB used was 0.01 ug/kg (Hakanson, 1980)
Tfi = Toxic response factor for PCBs used, and the value used was 40 (Hakanson, 1980)
The interpretation and significance of PERI is given as follows:
1) low potential ecological risk Eir < 40,
2) moderate potential ecological Risk Eir = 40-79,
3) considerable potential ecological risk Eir = 80-159,
4) High potential ecological risk Eir = 160-319,
5) Very high potential ecological risk Eir > 320 (Hakanson, 1980).
3.8. Mitigation and Management Recommendations
Based on the findings, mitigation and management strategies for addressing PCB contamination in local crude oil refining sites were proposed. Regulatory measures, best practices, and community engagement were considered.
4. Result
Presentation of Results
Let SSL1, SSL2, SSL3, SSL4, represent Ebean lake, Forcados river, Orashi river, and Rumuogodo River.
Table 1. PCB concentration levels in sediment samples.

FIELD ID

Ebean Lake

Forcados River

Orachi River

Rumuogodo River

DEPTH (0-2 m)

NA

NA

NA

NA

Sample Co-Ordinates

TEST METHOD

Latitude: 5.6867° N

Longitude: 7.9756° E

Latitude: 5.3050° N

Longitude: 6.41665° E

Latitude: 5.8089° N

Longitude: 7.0731° E

Latitude: 4.9187061° N

Longitude: 6.7895574° E

NA

NA

NA

NA

Unique Laboratory Number

2023/2067

2023/2068

2023/2069

2023/2070

PCB, ug/kg

4,4’-Dichlorobiphenyl

65.86

226.7

33.2

19.47

2,3,4,4’5-Pentachlorob

63.59

16.35

8.63

7.72

2,2’,3,3’,4,5-Hexachlo

68.43

9.46

28.56

7.42

2,2’,3,4,4’,5-Haxaclo

15.17

12.31

42.82

27.12

2,2’,4.4’,5,5’-Hexachl

49.63

48.62

67.86

67.53

2,2’,3,3’,4,4’,6-Hepta

86.13

11.99

29.39

36.82

2,2’,3,4,4’,5’,6-Hepta

USEPA 8082A

127

824

120.1

65.09

2,2’,3,4,5,5’,6-Heptac

23.23

27.44

39.55

28.92

2,3,3’,4,4’,5,5’-Hepta

33.33

102.2

10.9

21.49

2,3,3’,4,4’,5’,6-Hepta

23.41

35.39

23.74

11.87

2,2’,3,3’,4,5’,6,6’-Oc

5.72

4.52

3.84

8.02

2,2’,3,3’,4,5,5’,6’-Oc

160.9

56.78

62.76

29.89

2,2’,3,4,4’,5,5’,6-Oct

185.8

31.65

<1

27,59

2,2’,3,3’,4,4’,5,5’,6-nona

142.5

35.83

13.98

25.78

Decachlorobiphenyl

<1

158.6

<1

<1

Total

1051

1602

485.3

384.8

Table 2. Descriptive analysis of PCB concentration levels in sediment samples.

Congeners

Ebean

Forcados

Urashi

Choba

Mean

Median

Max

Min

Skewness

PCB15

65.86

226.7

33.2

19.47

55.73709

49.53

226.7

19.47

1.017849

PCB114

63.59

16.35

8.63

7.72

16.22309

12.49

63.59

7.72

1.084459

PCB129

68.43

9.46

28.56

7.42

19.24531

19.01

68.43

7.42

0.809533

PCB137

15.17

12.31

42.82

27.12

21.57968

21.145

42.82

12.31

0.546058

PCB153

49.63

48.62

67.86

67.53

57.66569

58.58

67.86

48.62

-0.00395

PCB171

86.13

11.99

29.39

36.82

32.51354

33.105

86.13

11.99

0.780604

PCB183

127

824

120.1

65.09

169.1208

123.55

824

65.09

1.133999

PCB185

23.23

27.44

39.55

28.92

29.22096

28.18

39.55

23.23

0.731696

PCB188

33.33

102.2

10.9

21.49

29.88734

27.41

102.2

10.9

0.987311

PCB191

23.41

35.39

23.74

11.87

21.9813

23.575

35.39

11.87

0.009916

PCB201

5.72

4.52

3.84

8.02

5.312024

5.12

8.02

3.84

0.605759

PCB199

160.9

56.78

62.76

29.89

64.34134

59.77

160.9

29.89

0.933578

PCB203

185.8

31.65

<1

27.59

76.68487

108.725

185.8

31.65

0

PCB206

142.5

35.83

13.98

25.78

36.83095

30.805

142.5

13.98

1.076506

PCB209

<1

158.6

<1

<1

158.6

158.6

158.6

158.6

0

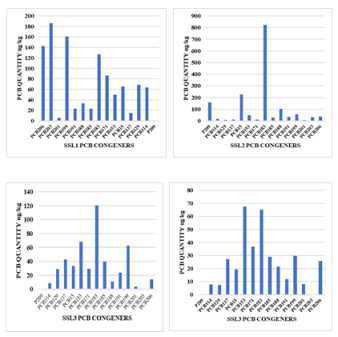
Figure 2. Graph of PCB congeners against quantity (ug/kg).
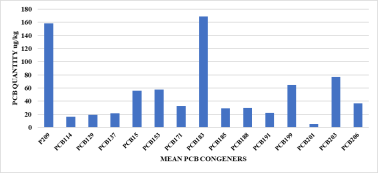
Figure 3. Mean PCB congener level of the four (4) sampling locations.
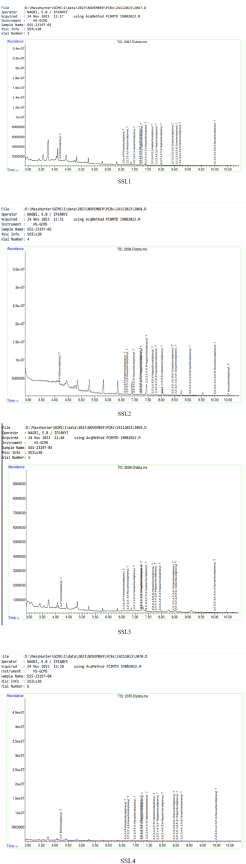
Figure 4. Chromatogram of sediment samples.
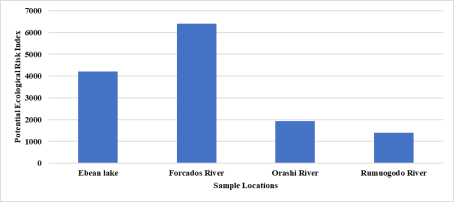
Figure 5. Potential Ecological Risk Index of PCBs in sediments of sample location in the Niger delta region.
The concentrations of PCB congeners in sediment samples from Ebean Lake (Abia State), Forcados River (Bayelsa State), Orashi River (Imo State) and Rumuogodo River (Rivers State) were ascertained using the United States Environmental Protection Agency (USEPA 8082A) standard, and are demonstrated in Table 1.
A total of fifteen (15) PCB congeners were detected in all the samples. Out of the 28 congeners analyzed, PCB (15, 114, 129, 137, 153, 171, 183, 185, 188, 191, 201, 199, 203, 206 and 209) were the most widely detected. The mean congener concentration level in all sediments ranged from 5.312 ug/kg (PCB 201) to 169.121 ug/kg (PCB 183) dry weight. Most values of the skewness statistics were in the range of -0 to 1 indicating negatively skewed data. This suggests that there are more occurrences of higher PCB congener values and fewer occurrences of lower PCB congener values.
Concentrations of total PCBs (∑15 PCBs) ranged from 357.14 ug/kg (Rumuogodo River) among the four sampling points to 1601.84 ug/kg (Forcados River) also among the four sampling points.
2. In this study, the ecological risk assessment of PCBs was evaluated by using the Potential ecological risk index (PERI). The PCB concentration in sediments from the Niger Delta region was far above the significant Interim sediment quality guidelines (ISQG) and the potential ecological (PERI) values (Hakanson, 1980). This signifies a potential adverse effect on the ecosystem. The potential ecological risk of PCBs in sediments from the Niger Delta region ranged from 1394.92 (Rumuogodo River) to 6407.36 (Forcados River), which signifies a very high potential ecological risk for sediment exposure to the ecosystem.
3. Mitigation and Management Recommendations
The high PERI values suggest that according to the risk assessment conducted, the potential ecological risk index for PCB in the sediments is elevated. This indicates a substantial potential ecological risk associated with the presence of PCBs in the Niger Delta region. These states may be experiencing significant environmental stress due to the presence of this high level of PCB in the sediment from artisanal refineries.
High PERI values are not just a concern, but also signify a potential threat to the local ecosystem. This emphasizes the urgency of taking action to address the adverse environmental impact associated with PCB contamination due to artisanal refining. There is a need to improve the mitigation measures to reduce the adverse impacts of PCBs on the ecosystem, necessitating immediate attention and intervention to safeguard the environmental health of the Niger Delta region. This can be done through clean-up, imposing government regulations like the pollute and pay principle etc. on artisanal refining, and implementing mitigation measures to prevent further environmental degradation and protect the ecosystem.
5. Conclusion
From this analysis, higher chlorinated PCBs have a greater concentration range in sediments around local crude oil refining sites than the PCB concentration range in sediments around non-crude oil refineries. Also, a plot of the Ecological risk index against sample points shows that the Forcados River in Bayelsa state has a very high environmental risk level of PCB contamination. From the result, the danger PCBs pose in the Niger Delta region is very high, therefore it is recommended that destructive technology for the remediation of the contaminated environment from PCBs and government regulation should be imposed on local refining of crude oil around the Niger Delta Region.
Abbreviations

DDT

Dichlorodiphenyltrichloroethane

DOM

Dissolved Organic Matter

GC-MS

Gas Chromatography-Mass Spectrometry

HPCL

Methylene Chloride

HQ

Hazard Quotient

HCL

Hydrogen Chloride

ILCR

Incremental Life Cancer Risk

LRRN

Lower Reaches of the River Niger

PCB

Polychlorinated Biphenyls

PCDD/Fs

Polychlorinated Dibenzo-p-Dioxins and Polychlorinated Dibenzofurans

PERI

Potential Ecological Risk Index

PEL

Probable Effect Level

POP

Persistent Organic Pollutants

ISQG

Interim Sediment Quality Guidelines

USEPA

United States Environmental Protection Agency

QA/QC

Quality Assurance Quality Control

SQG

Sediment Quality Guidelines

SSL1, 2, 3, 4

Sediment Sample elevated Concentration Level

Conflicts of Interest
The authors declare no conflicts of interest.
References
[1] Abramowicz DA (1994) Aerobic PCB degradation and anaerobic PCB dechlorination in the environment. Res Microbiol 145: 42-46.
[2] Aganbia, E, Chukwujindu M. A. Iwegbue, and Bice S. Martincigh, (2019), Concentrations and risks of polychlorinated biphenyls (PCBs) in transformer oils and the environment of a power plant in the Niger Delta, Nigeria.
[3] Adesina Olusola Adedayo, Ifesinachi Ezengwa, Khadijat Abdulkareem Abdulraheem, Adesanmi Adewole, Okedere Oyetunji, (2023), Soil concentrations of Polychlorinated Biphenyl in a typical Nigerian University environment and its risk assessment.
[4] Aziza, A. E, Chukwujindu M A Iwegbue, Godswill O Tesi, Godwin E Nwajei, Bice S Martincigh, (2021), Concentrations, sources, and exposure risk of polychlorinated biphenyls in soil profiles of the floodplain of the lower reaches of the River Niger, Nigeria.
[5] Angelika Beyer & Marek Biziuk (2009) Environmental Fate and Global Distribution of Polychlorinated Biphenyls.
[6] Baqar, M., Sadef, Y., Ahmad, S. R., Mahmood, A., Qadir, A., Aslam, I., Li, J., Zhang, G. (2017) Occurrence, ecological risk assessment, and spatiotemporal variation of polychlorinated biphenyls (PCBs) in water and sediments along River Ravi and its northern tributaries, Pakistan. Environ. Sci. Pollut. Res. 24, 27913-27930.
[7] Bedard D. L, May R. J (1996) Characterization of the polychlorinated biphenyls in the sediments of Woods Pond: Evidence for microbial dechlorination of Aroclor 1260 in situ. Environ Sci Technol 30: 237-245.
[8] Bedard, D. L., Van Dort, H. M. (1997). The Role of Microbial PCB Dechlorination in Natural Restoration and Bioremediation. In: Sayler, G. S., Sanseverino, J., Davis, K. L. (eds) Biotechnology in the Sustainable Environment. Environmental Science Research, vol 54. Springer, Boston, MA.
[9] Berkaw M, Sowers K. R, May H. D (1996) Anaerobic ortho dechlorination of polychlorinated biphenyls by estuarine sediments from Baltimore Harbor. Appl Environ Microbiol 62: 2534-2539.
[10] Borja, J., Taleon, D. M., Auresenia, J., Gallardo, S., 2005. Polychlorinated biphenyls and their biodegradation. Process Biochem.
[11] Brown JF Jr., Wagner RE (1990) PCB movement, dechlorination, and detoxication in the Acushnet estuary. Environ Toxicol Chem 9: 1215-1233.
[12] Brown JF Jr., Wagner RE, Feng H, Bedard DL, Brennan MJ, Carnahan JC, May RJ (1987) Environmental dechlorination of PCBs. Environ Toxicol Chem 6: 579-593.
[13] CBS, 1980. PCBs in Nederland, Centraal Bureau voor de Statistiek, Staatsuitgeverij, ‘s-Gravenhage.
[14] Cui, S., Fu, Q., Guo, L., Li, Y. F., Li, T.-X., Ma, W. L., Wang, M., Li, W. L., 2016. Spatial-temporal variation, possible source and ecological risk of PCBs in sediments from Songhua River, China: effects of PCB elimination policy and reverse management framework. Mar. Pollut. Bull. 106, 109-118.
[15] Duan, X, Li, Y, Li, X, Zhang, D and Li, M, (2013), Polychlorinated biphenyls in sediments of the Yellow Sea: Distribution, source identification and flux estimation, Marine Pollution Bulletin, Volume 76, Issues 1-2, 15 November 2013, Pages 283-290,
[16] Eckhardt, S, Breivik, K, Mano, S, and Stohl, A, (2007), Record high peaks in PCB concentrations in the Arctic atmosphere due to long-range transport of biomass burning emissions, Atmos. Chem. Phys. 7 (2007) 4527-4536.
[17] Fiedler, H., (1997), Polychlorinated biphenyls (PCBs): use and environmental releases. Proceedings of the Subregional Meeting on Identification and Assessment of Releases of Persistent Organic Pollutants (POPs). Inter-organization Programme for the Sound Management of Chemicals. Russian Federation, St. Petersburg, pp.
[18] Fish KM, Principe JM (1994) Biotransformations of Aroclor 1242 in Hudson River test tube microcosms. Appl Environ Microbiol 60: 4289-4296.
[19] Gloria Ihuoma Ndukwe, (2018), Assessment of the levels of polychlorinated biphenyls in sediments of new Calabar River, Niger Delta Region, Nigeria.
[20] Gómez-Gutiérrez, A., Garnacho, E., Bayona, J. M., Albaigés, J., (2007), Assessment of the Mediterranean Sediments Contamination by Persistent Organic Pollutants. Environ. Pollut. 148, 396-408.
[21] Greve, P. A. and Wegman, R. C. C., (1983), 'PCB residues in animal fats, human tissues, duplicate 24-hour diets, eel and sediments', Proceedings of PCB seminar, Scheveningen, The Hague, Netherlands, 28-30 September 1983, pp. 54-65.
[22] Hakanson, L., (1980), An Ecological Risk Index for Aquatic Pollution Control: A Sedimentological Approach. Water Res. 14 (8), 975-1001.
[23] Huang, J, Matsumura, T, Yu, G, Deng, S, Yamauchi, M, Yamazaki, N, Weber, R, (2011), Determination of PCBs, PCDDs and PCDFs in insulating oil samples from stored Chinese electrical capacitors by HRGC/HRMS, Chemosphere, Volume 85, Issue 2, September 2011, Pages 239-246,
[24] Irerhievwie, G. O, Chukwujindu, M. A, Iwegbue, B, Lari, Godswill O Tesi, Godwin E Nwajei, Bice S Martincigh, (2020), Spatial characteristics, sources, and ecological and human health risks of polychlorinated biphenyls in sediments from some river systems in the Niger Delta, Nigeria.
[25] Iniaghe Paschal and Enyohwo Kpomah, (2022), Polychlorinated Biphenyl (PCBs) in Water and Sediments along the Udu River, Niger Delta, Nigeria: Concentration, Distribution and Risk Assessment.
[26] Janna G. Koppe and Jane Keys (2000), PCBs and the Precautionary Principle.
[27] Jensen, S., Johnels, A. G., Olsson, M. and Otterlind, G., (1969), ‘DDT and PCB in Marine Animals from Swedish Waters’, Nature Vol. 224, p. 247.
[28] Lai, Z., Li, X., Li, H., Zhao, L., Zeng, Y., Wang, C., Gao, Y., Liu, Q., (2015), Residual distribution and risk assessment of polychlorinated biphenyls in surface sediments of the Pearl River Delta, South China. Bull. Environ. Contam. Toxicol. 95, 37-44.
[29] Lidgett, R. A. and Vodden, H. A. (1970), The environmental problem. Pp. 88-96 in PCB Conference, Wenner-Gren Center, Sept. 29, 1970. Stockholm: National Swedish Environment Protection Board.
[30] Long E. R, MacDonald D. D, Smith S. L, Calder F. D, (1995), Incidence of adverse biological effects within ranges of chemical concentrations in marine and estuarine sediments. Environ Manage 1995; 19: 81-97.
[31] Long E. R, Morgan L. G, (1990), The potential for biological effects of sediment-sorbed contaminants tested in the National Status and Trends Program, vol. 52. Seattle: NOAA Technical Memorandum NOS OMA; 1990.
[32] MacDonald D. D, Carr R. S, Calder F. D, Long E. R, Ingersoll C. G, (1996), Development and evaluation of sediment quality guidelines for Florida coastal waters. Ecotoxicology 1996; 5: 253-78.
[33] Nouira, T, Risso, C, Chouba Lassaad, C, Hélène Budzinski, H and Hamadi Boussetta, H, (2013), Polychlorinated biphenyls (PCBs) and Polybrominated Diphenyl Ethers (PBDEs) in surface sediments from Monastir Bay (Tunisia, Central Mediterranean): Occurrence, distribution and seasonal variations, Chemosphere, Volume 93, Issue 3, September 2013, Pages 487-493,
[34] Nisbet, I. C. T, & Sarofim, A. F. (1972). Rates and Routes of Transport of PCBs in the Environment. Environmental Health Perspectives, 1, 21-38.
[35] Oyinkepreye Lucky Bebeteidoh, Simon Kometa, Kayvan Pazouki, Rose Norman, (2020). Sustained impact of the activities of local crude oil refiners on their host communities in Nigeria.
[36] Papageorge, W. B. and Wheeler, E. P. (1971), (Monsanto). Personal communication, 8 February.
[37] Peterson, A. (1970), Possibilities of destruction. Pp. 82-87 in PCB Conference, Wenner-Gren Center, Sept. 29, 1970. Stockholm: National Swedish Environment Protection Board.
[38] Quensen, J. F. III, Tiedje, J. M., Boyd, S. A., (1988), Reductive dechlorination of polychlorinated biphenyls by anaerobic microorganisms from sediments, Science 242: 752-754.
[39] Schmidt, T. T., Risebrough, R. W., and Gress, F. (1971), Input of polychlorinated biphenyls into California coastal waters from urban sewage outfalls. Bull. Environ. Contain. Toxicol. 6: 235.
[40] Tang, X, Hashmi, M. Z, Zeng, B, Yang, J, and Shen, C. F, (2015), Application of iron-activated persulfate oxidation for the degradation of PCBs in soil, Chem. Eng. J. 279 (2015) 673-680. [12] J. Wu, J. C. Hu, S. J. Wang,
[41] Unyimadu, J. P, Osibanjo, O and Babayemi, J. O, (2018), Polychlorinated biphenyls (PCBs) in River Niger, Nigeria: Occurrence, distribution and composition profiles,
Cite This Article
  • APA Style

    Osokogwu, U., Kadiri, O. E. (2025). Investigation of Polychlorinated Biphenyls (PCB) on Sediments in Selected Artisanal Crude Oil Refining Sites in Niger Delta. Journal of Energy, Environmental & Chemical Engineering, 10(3), 78-91. https://doi.org/10.11648/j.jeece.20251003.11

    Copy | Download

    ACS Style

    Osokogwu, U.; Kadiri, O. E. Investigation of Polychlorinated Biphenyls (PCB) on Sediments in Selected Artisanal Crude Oil Refining Sites in Niger Delta. J. Energy Environ. Chem. Eng. 2025, 10(3), 78-91. doi: 10.11648/j.jeece.20251003.11

    Copy | Download

    AMA Style

    Osokogwu U, Kadiri OE. Investigation of Polychlorinated Biphenyls (PCB) on Sediments in Selected Artisanal Crude Oil Refining Sites in Niger Delta. J Energy Environ Chem Eng. 2025;10(3):78-91. doi: 10.11648/j.jeece.20251003.11

    Copy | Download

  • @article{10.11648/j.jeece.20251003.11,
      author = {Uche Osokogwu and Okpo Emmanuel Kadiri},
      title = {Investigation of Polychlorinated Biphenyls (PCB) on Sediments in Selected Artisanal Crude Oil Refining Sites in Niger Delta
    },
      journal = {Journal of Energy, Environmental & Chemical Engineering},
      volume = {10},
      number = {3},
      pages = {78-91},
      doi = {10.11648/j.jeece.20251003.11},
      url = {https://doi.org/10.11648/j.jeece.20251003.11},
      eprint = {https://article.sciencepublishinggroup.com/pdf/10.11648.j.jeece.20251003.11},
      abstract = {The concentration level of 15 PCB congeners and associated risk to the ecosystem were investigated in sediments around local crude oil refining sites in the Niger Delta region of Nigeria. The gas Chromatography-Mass spectrometry (Agilent 8082A USEPA) method was applied for the identification and quantification of PCBs in sediments from four sites around the Niger Delta. The ∑15 PCB concentration level in sediments ranged from <1 (PCB 209) to (PCB 203) 185 ug/kg for SSL1(Ebean Lake) sediment sample, (PCB 201) 4.52 ug/kg to (PCB 183) 824 ug/kg for SSL2 (Forcados river) sediment sample, (PCB 203 and PCB 209) <1 ug/kg to (PCB 183) 120.1 ug/kg for SSL3 (Urashi River) sediment sample, and (PCB 209) <1 ug/kg to (PCB 153) 67.53 ug/kg for SSL4 (Choba River) sediment sample elevated concentration level of PCB were found in the forcados river of Bayelsa state. Mean levels of ∑15 PCBs in sediment samples from the four sampling stations ranged from 5.31 ug/kg (PCB201) to 158.6 ug/kg (PCB 209). PCB concentration level in each sampling location was higher than the interim sediment quality Guidelines (ISQG). The risk/danger PCBs pose to the environment was evaluated and calculated using the potential ecological risk index, and recommendations for mitigation and management strategies were provided.},
     year = {2025}
    }
    

    Copy | Download

  • TY  - JOUR
    T1  - Investigation of Polychlorinated Biphenyls (PCB) on Sediments in Selected Artisanal Crude Oil Refining Sites in Niger Delta
    
    AU  - Uche Osokogwu
    AU  - Okpo Emmanuel Kadiri
    Y1  - 2025/08/04
    PY  - 2025
    N1  - https://doi.org/10.11648/j.jeece.20251003.11
    DO  - 10.11648/j.jeece.20251003.11
    T2  - Journal of Energy, Environmental & Chemical Engineering
    JF  - Journal of Energy, Environmental & Chemical Engineering
    JO  - Journal of Energy, Environmental & Chemical Engineering
    SP  - 78
    EP  - 91
    PB  - Science Publishing Group
    SN  - 2637-434X
    UR  - https://doi.org/10.11648/j.jeece.20251003.11
    AB  - The concentration level of 15 PCB congeners and associated risk to the ecosystem were investigated in sediments around local crude oil refining sites in the Niger Delta region of Nigeria. The gas Chromatography-Mass spectrometry (Agilent 8082A USEPA) method was applied for the identification and quantification of PCBs in sediments from four sites around the Niger Delta. The ∑15 PCB concentration level in sediments ranged from <1 (PCB 209) to (PCB 203) 185 ug/kg for SSL1(Ebean Lake) sediment sample, (PCB 201) 4.52 ug/kg to (PCB 183) 824 ug/kg for SSL2 (Forcados river) sediment sample, (PCB 203 and PCB 209) <1 ug/kg to (PCB 183) 120.1 ug/kg for SSL3 (Urashi River) sediment sample, and (PCB 209) <1 ug/kg to (PCB 153) 67.53 ug/kg for SSL4 (Choba River) sediment sample elevated concentration level of PCB were found in the forcados river of Bayelsa state. Mean levels of ∑15 PCBs in sediment samples from the four sampling stations ranged from 5.31 ug/kg (PCB201) to 158.6 ug/kg (PCB 209). PCB concentration level in each sampling location was higher than the interim sediment quality Guidelines (ISQG). The risk/danger PCBs pose to the environment was evaluated and calculated using the potential ecological risk index, and recommendations for mitigation and management strategies were provided.
    VL  - 10
    IS  - 3
    ER  - 

    Copy | Download

Author Information
  • Abstract
  • Keywords
  • Document Sections

    1. 1. Introduction
    2. 2. Literature Review
    3. 3. Materials and Methods
    4. 4. Result
    5. 5. Conclusion
    Show Full Outline
  • Abbreviations
  • Conflicts of Interest
  • References
  • Cite This Article
  • Author Information